Unlock this article, live events, and more with a subscription!
Already a subscriber? Log In
We're already into April, firmly ensconced in freestyle szn, but that doesn't mean we can't circle back and do even more analysis regarding the NCAA tournament. We can even include analyses of tournaments from the past 20+ years.
We're literally only bounded by our imaginations and our available datasets. Moreso the latter.
Anyhow, don't forget to check out the original By The Numbers article for the 2022 NCAA Championships.
Now on to the new analysis. But before we do that, check out this map of D1 NCAA men's wrestling programs from our friends at the NWCA.
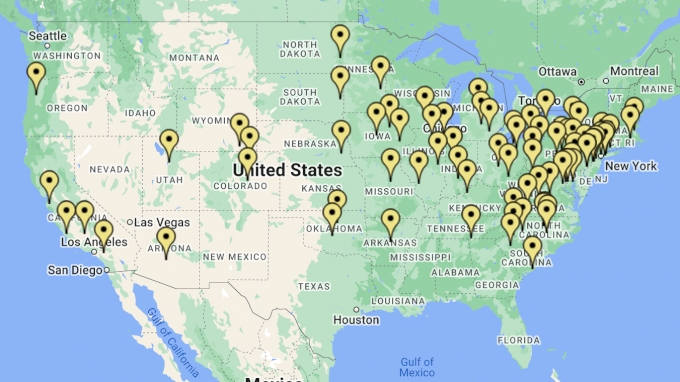
You can check out other maps here.
The numbers were looking at all come from D1 programs (not that we don't celebrate all levels of wrestling!) so we thought we'd start with a nice map of where you can find all those current programs.
Of course, we would prefer if there were more programs in places like Texas, Florida, Washington, etc, but that's a topic for another time!
Our first topic for right now is a graph of how trophy teams from the 2022 NCAA Championships did over the course of the 2021-22 season.
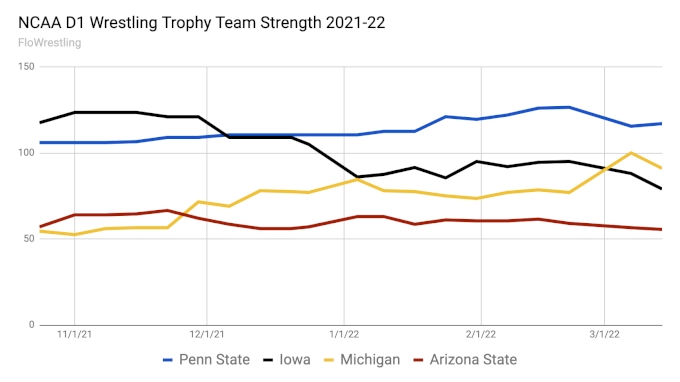
The numbers are taken from the weekly NCAA Rankings, which you can find here. We plotted the hypothetical team scores over time and connected the dots with color-coded lines. That's good graphing, baby!
From the graph you can see when Spencer Lee announced he was done for the season and we removed him (and his hypothetical team points) from the rankings. In the first rankings of 2022, Penn State become the favorite and never looked back.
We can also observe that, despite winning the Big Ten Tournament, Michigan was never favored to beat Penn State at NCAAs, and that the Wolverines in fact fared better at Big Tens and NCAAs than their regular season would predict.
And while Hawkeye fans were no doubt hoping and expecting more points at the NCAA tournament, Iowa was only slightly off their mid-season projections, after injuries had already taken their toll.
Penn State and Arizona State, meanwhile, both stayed fairly consistent all season long, and finished the season about where they were expected to, based on the results from the rest of the school year.
Which goes to show how little unpredictability there is in wrestling from a team race perspective. Which should come as no surprise to anyone that has followed the sport closely for just about any length of time. Cinderella stories just don't happen due to the structure of the season and the nature of the sport, for better or for worse.
Moving on, below is the same style graph for teams that finished in the top ten at the 2022 NCAA Championships but didn't win a trophy (so #5 thru #10).
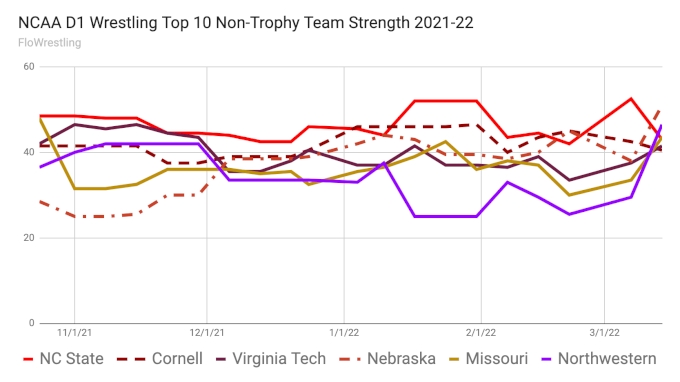
We understand that North Carolina State fans were disappointed by the results from the tournament, but they still finished mostly in line with their projects from the regular season.
Cornell was even more in line with expectations, while Nebraska, Missouri, Virginia Tech, and especially Northwestern, all finished the season on a high note.
Also, a quick reminder that Flo's rankings archives for the entire NCAA season are available. Just toggle the menu under the date. It's all there! Even the terrible wordplay in the weight class titles!
We will now examine several of the major conferences in closer detail.
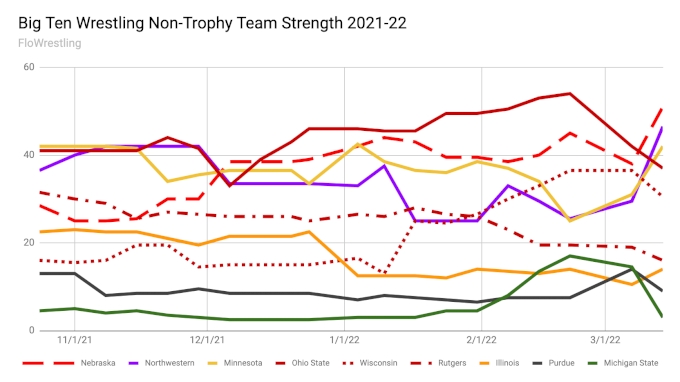
We left out the three trophy teams as well as Indiana and Maryland. We're big fans of both of those latter two programs and see big things on the horizon for them, but the graph is already very cluttered and when you don't have a lot of ranked guys at the end of the year, your team doesn't show up much on this type of graph.
Once again we see Nebraska and Northwestern's strong finishes. Conversely, the Buckeyes trailed off in March after a stronger regular season.
March was particularly cruel for Spartan fans, as their hopes were inflated late in the season only to be dashed by a brutal tournament. This sport can be a real jerk like that sometimes!
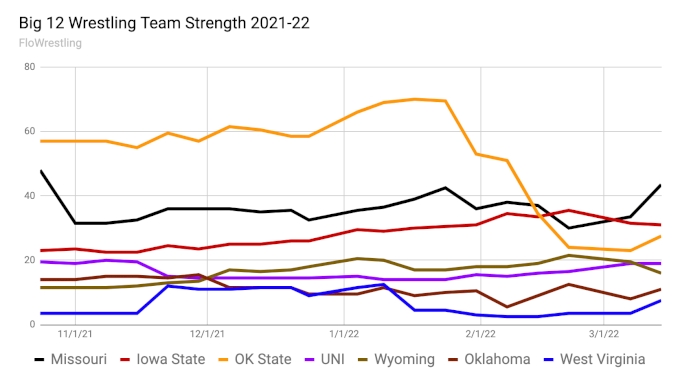
This season was one to forget for Oklahoma State fans. Injuries and under performances let a lot of the air out of some lofty mid-season expectations.
On the other hand, Missouri fulfilled some very early season hype at the NCAAs. Everyone else stayed more or less within reasonable bounds.
Several Big 12 teams were left off the graph for similar reasons as stated above in the Big Ten analysis.
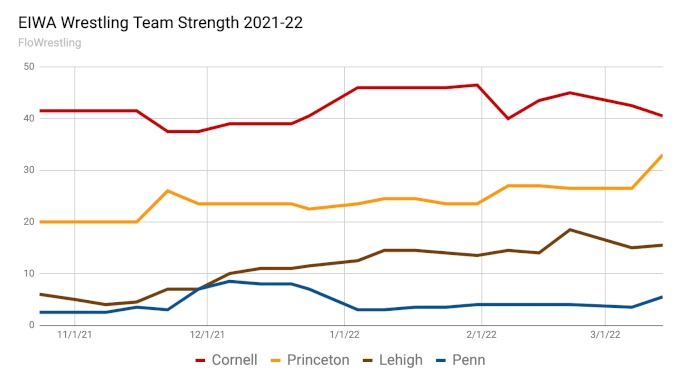
To simplify things, we only graphed the four best NCAA finishes by EIWA teams. As you can see, the Ivies returned in a big way, with Cornell resuming their usual excellent ways with Princeton not far behind (and gaining).
Lehigh salvaged a snakebitten season of injuries while Penn showed they can deliver results after many years of showing tremendous potential.
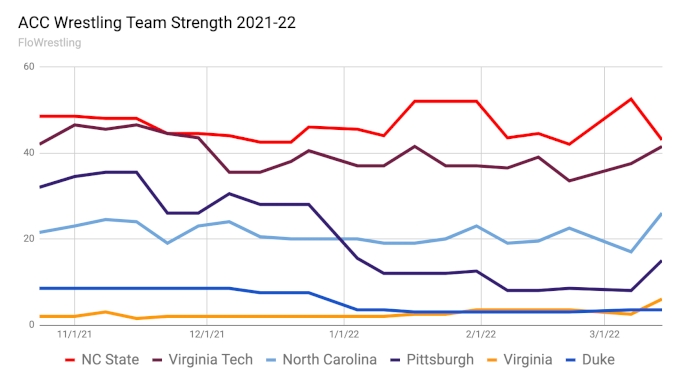
The ACC continues to be one of the strongest conferences from top to bottom, and could have been even stronger had Pitt maintained their momentum from the 2021 postseason.
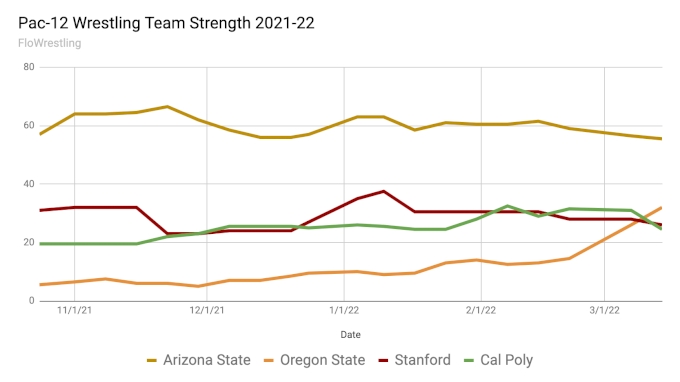
What an incredible surge by Oregon State late in the season! One of the most impressive March runs we can ever remember!
Cal Poly also added some firepower to one of the best Pac-12 seasons in a long time.
Going back a bit further, we can look at the strength of every conference since the 2000 tournament (not including 2020). We used approximate team points earned at the NCAA tournament based on finish, not factoring in bonus points (so they won't line up to exact tournament points). We do that because that's all the data we have available. It's a limiting factor, as they say in the data biz!
Sadly, several of these conferences are no longer in existence (at least for wrestling, which is the only sport we're concerned with at the moment).
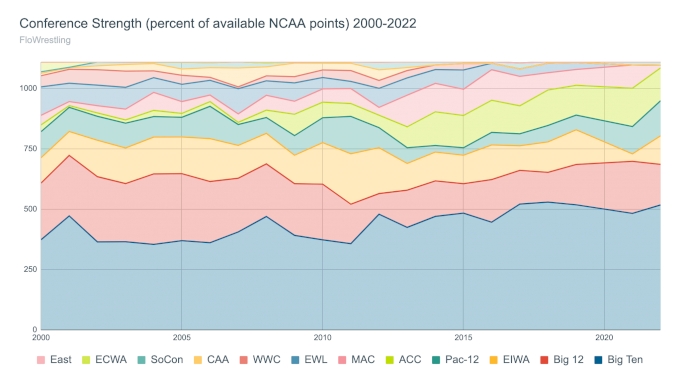
The Big Ten gains some ground since 2011, but also added two teams since then. You can also see the EIWA dip in 2021 as the Ivy's did not participate in that NCAA tournament.
You can also see the decline in performance from the MAC, even after they absorbed the EWL teams, which were themselves once a major force at the tournament. All those programs, as well as those of the SoCon, are important, nay, vital to the overall health of college wrestling. However, the NCAA tournament is a zero-sum game, and there are only so many points to go round!
We also looked at individual teams since 2000 and broke it down into chunks of time to make it easier to read.
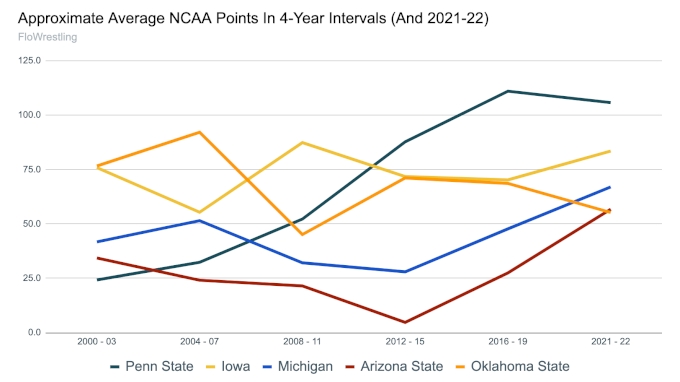
Not a ton of surprises here. Honestly, we were just messing around with the data and eventually got this graph, so now you get it too!
We now turn our attention to home states! Everyone loves to see how different states did at the NCAA tournament.
We used the same hypothetical scoring based on tournament placement (like before) and applied it to the states each wrestler listed in their athlete bio pages on the school's official team website.
Don't think certain wrestlers should "count" for the states they listed on their bios? Too bad! Take it up with the athletes! Not our problem!
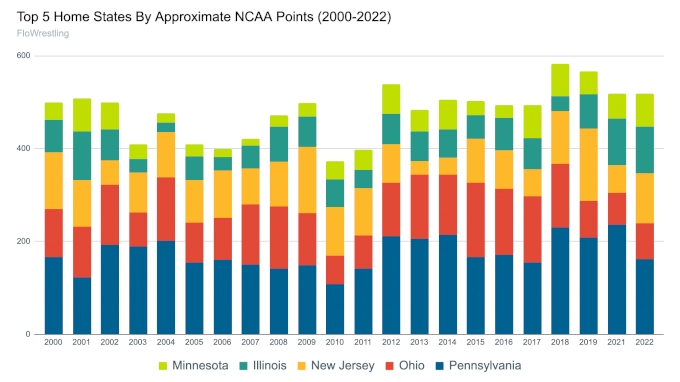
Here we see the top 5 states faired since the year 2000.
David Taylor and Logan Steiber were the anchors of a strong decade for Ohio in the 2010's. New Jersey had has some lean years but is most often found in the #2 or #3 spot. And of course, Pennsylvania is the top dog just about every year, by any absolute measurement.
We didn't get into per capita data here, so save all your comments about those calculations for another time.
Okay fine, here's the 2022 points per capita table.
Now let's get into greater detail by narrowing down our time ranges, which would also be a perfect opportunity to bust out some pie charts.
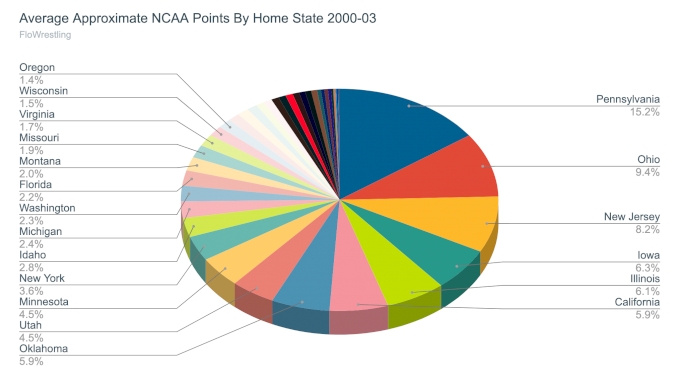
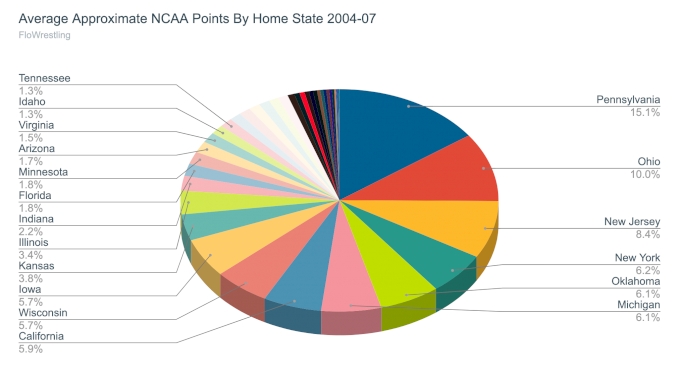
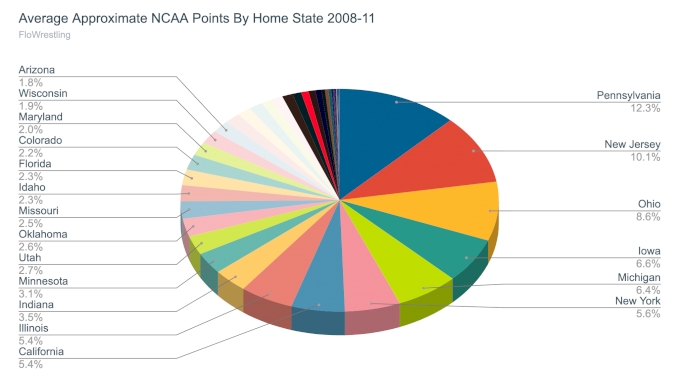
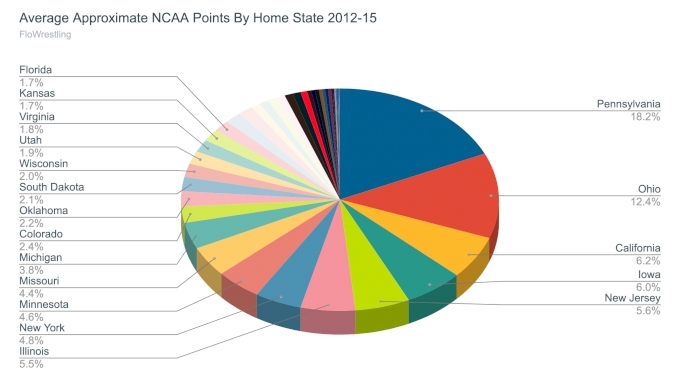
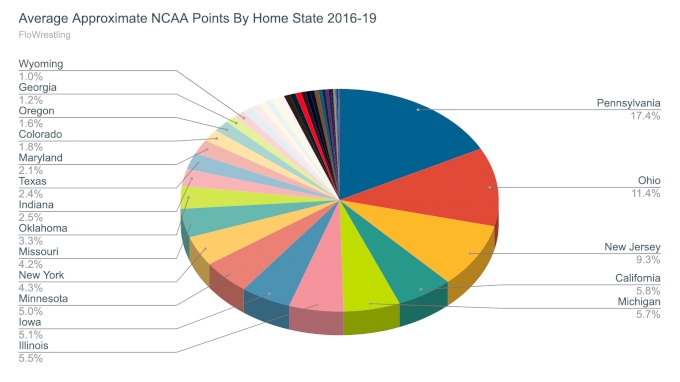
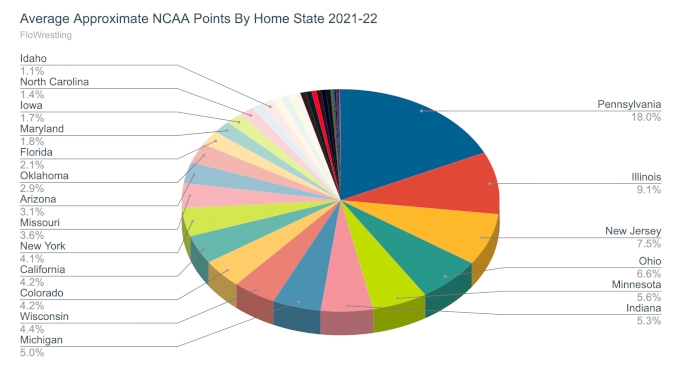
All the deliciously informative pie charts pretty much speak for themselves.
We also noticed some other By The Numbers nuggets in the course of our research. Did you know...?
- The Pac-12 had 13 All-Americans. That's the most in at least 22 years, which is as far back as our data goes. The next highest we could find for the Pac-12 was 11 AAs in 2011.
- The MAC had no All-Americans for the first time since 2001? Additionally, in 2006, 2007, and 2008 the only All-Americans for the conference came from Central Michigan.
- Not counting the NWCA All-Americans from 2020, the Big Ten had more All-Americans (39) than any other time in the last 22 years. Maybe ever! Again, we're limited by our data.
- Despite it being a down year for Oklahoma State (one of their lowest finishes in history), the Cowboys still secured two All-Americans for the 12th consecutive tournament. Every year since 2010!
- Penn State has at least five All-Americans at every tournament since 2011. The Cael years have been good for Happy Valley!
- Cornell had at least one All-American every year since 2001. Rob Koll built a winner in Ithaca!
- App State had back-to-back All-Americans for the first time since 2002-03.
- UPenn had their first All-American since 2016.
- Cal Poly had two All-Americans for the first time since 2012. In 2021 the Mustangs earned a 3rd and 4th place finish. In 2012 it was a 3rd and an 8th. In 2004 they had a 4th and 6th place finisher.
- Rutgers had one All-American from 1984 to 2013. That's 30 seasons. From 2014 to 2022 (8 seasons not including 2020) they've had 16!
- Princeton had two All-Americans from 1986 to 2015 (also 30 seasons). In the five seasons from 2016 to 2022 (not including 2020 and 2021) they've had eight AAs!
- Adding Rider into the mix, if you combine all three of the D1 programs in New Jersey, you got just six All-Americans from 2000 to 2013. From 2014 to 2021 you got 28! It's a great time to be a fan of college wrestling in the Garden State!
- Dazjon Casto is the first bloodrounder or better for the Citadel since Luvsandorj placed 6th in 2014
- Oregon State had four All-Americans for the first time since 1995! Our data doesn't go back that far but we looked that one up special.
Want more NCAAs By The Numbers? Well good news, there is more to read (no guarantee that some of our above-stated trivia won't be repeated, we didn't double-check everything).
- You can read JD Rader's deep dive into how transfers factored into the tournament here.
- You can read Andy Hamilton's 50 Facts and Figures from the NCAAs here.
- You can read more NCAA trivia from Earl Smith at Intermat here.
- For specific Penn State-related trivia from Earl, click here.
- Willie's by the numbers article is here.
- And Richard Mann, also from Intermat, has even more by the numbers here.
Plus I wanted to include these excellent tweets from Alex Steen.
Pat Mckee is now 12-1 in consolation matches at the NCAA tournament. He has 13 tournament wins overall. The current record for D1 tournament wins is 22. McKee has 2 years of eligibility remaining.
— Alex Steen (@AlexSteenUNAT) March 21, 2022
Coach Blake is correct. Myles Amine broke the record for most D1 tournament wins this year in his 5th tournament. 22 remains the record for those competing at 4 tournaments. https://t.co/dIsIcHQxUG
— Alex Steen (@AlexSteenUNAT) March 22, 2022
Finally, I'm not entirely sure of the context of this tweet but I appreciate Adam Fellers sharing this graph!
Here you go @Benaskren the trend of total Division 1 transfers within the sport of wrestling since 2004. may have that FloQuant team locked up in the basement pic.twitter.com/bBfUr4DZcH
— The Intermat Bagman (@afellers01) April 6, 2022
Yes sir, we are absolutely living in the golden age of wrestling content!