
Unlock this article, live events, and more with a subscription!
Already a subscriber? Log In
Our annual statistical recap of the 2021 NCAA DI Wrestling Championships.
Previous NCAAs: By theNumbers - 2020 | 2019 | 2018 | 2017 | 2016 | 2015 | 2014
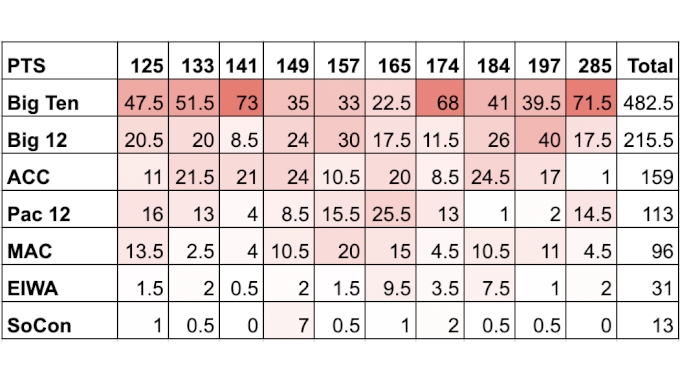
We'll start off with a table of the top 20 teams by team score and how many finishers they had per round. The cells are also color-coded. The deeper the share of red, the more points the team earned by the wrestlers who finished in the corresponding round or placement.
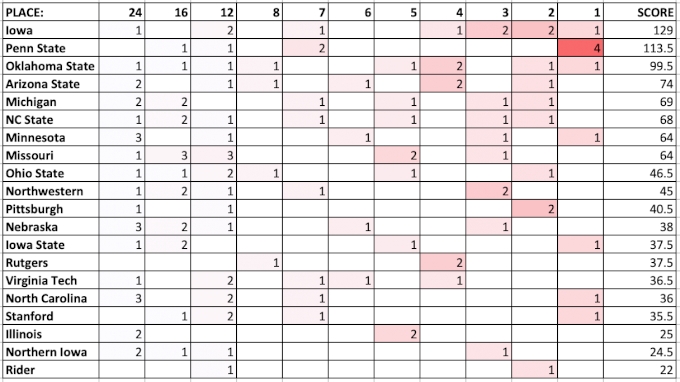
Iowa was able to get it done with 6 top-four placers versus Penn State's four champs. No great revelation but placing in the top four really helps your point total, and thus, final NCAA placement.
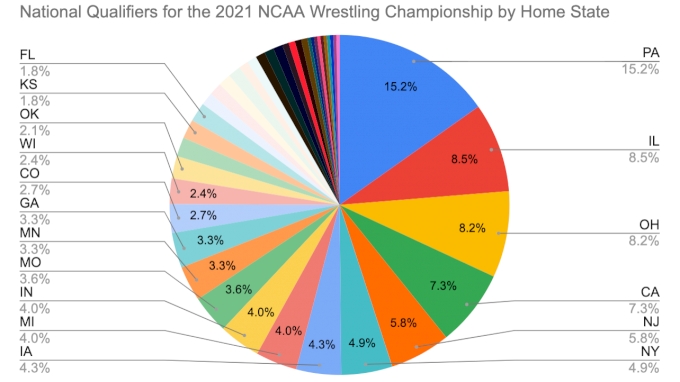
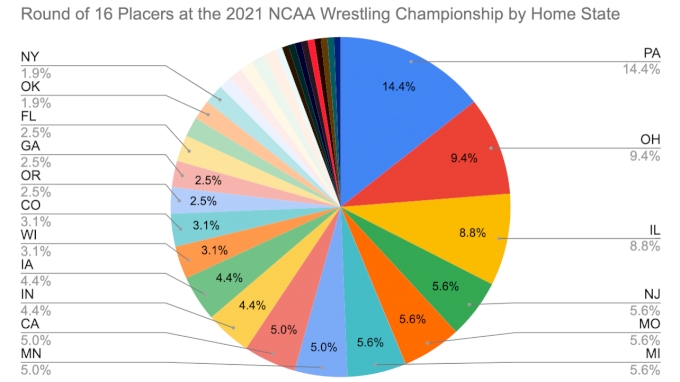
Now let's look at some numbers by the home state of the wrestlers. Those home states are taken directly from the team's bio pages.
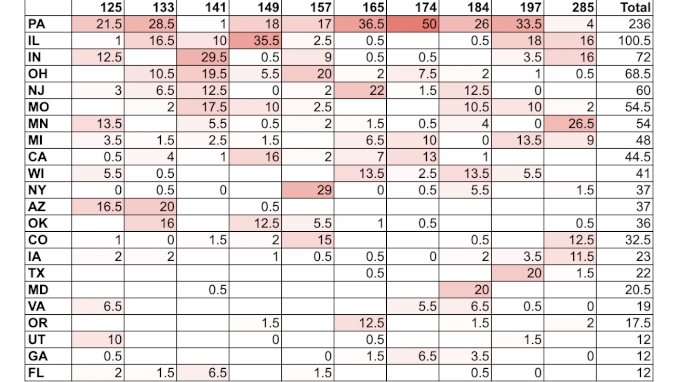
We'll break out some per capita numbers at some point, but some facts to keep in mind if those kinds of calculations interest you: CA is three times the size of PA, IL & OH, which are all similarly sized. NY is about 50% bigger than that trio and NJ is 25% smaller. Finally, you need four IA's to get the same number of people as one PA, IL or OH.
Raw numbers below.
| STATE | NQs | STATE | NQs | STATE | NQs |
| PA | 50 | WI | 8 | WV | 2 |
| IL | 28 | OK | 7 | MD | 2 |
| OH | 27 | VA | 6 | KY | 2 |
| CA | 24 | KS | 6 | CT | 2 |
| NJ | 19 | FL | 6 | WY | 1 |
| NY | 16 | UT | 4 | TN | 1 |
| IA | 14 | TX | 4 | NV | 1 |
| MI | 13 | OR | 4 | NM | 1 |
| IN | 13 | AZ | 4 | NH | 1 |
| MO | 12 | WA | 3 | NE | 1 |
| MN | 11 | ND | 3 | MA | 1 |
| GA | 11 | NC | 3 | HI | 1 |
| CO | 9 | MT | 3 | AL | 1 |
| ID | 3 | AK | 1 |
| STATE | R16s | STATE | R16s | STATE | R16s |
| PA | 23 | OR | 4 | WY | 1 |
| OH | 15 | GA | 4 | WV | 1 |
| IL | 14 | FL | 4 | WA | 1 |
| NJ | 9 | VA | 3 | NM | 1 |
| MO | 9 | OK | 3 | ND | 1 |
| MI | 9 | NY | 3 | NC | 1 |
| MN | 8 | UT | 2 | MD | 1 |
| CA | 8 | TX | 2 | ID | 1 |
| IN | 7 | MT | 2 | CT | 1 |
| IA | 7 | KS | 2 | AL | 1 |
| WI | 5 | AZ | 2 | ||
| CO | 5 |
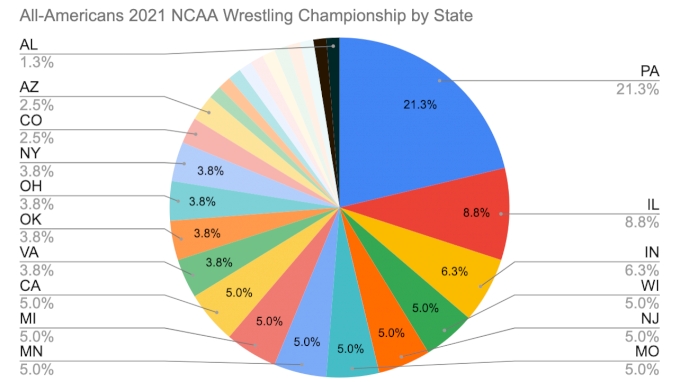
| STATE | AAs | STATE | AAs |
| PA | 17 | CO | 2 |
| IL | 7 | AZ | 2 |
| IN | 5 | WA | 1 |
| WI | 4 | UT | 1 |
| NJ | 4 | TX | 1 |
| MO | 4 | OR | 1 |
| MN | 4 | NC | 1 |
| MI | 4 | MD | 1 |
| CA | 4 | ID | 1 |
| VA | 3 | IA | 1 |
| OK | 3 | GA | 1 |
| OH | 3 | FL | 1 |
| NY | 3 | AL | 1 |
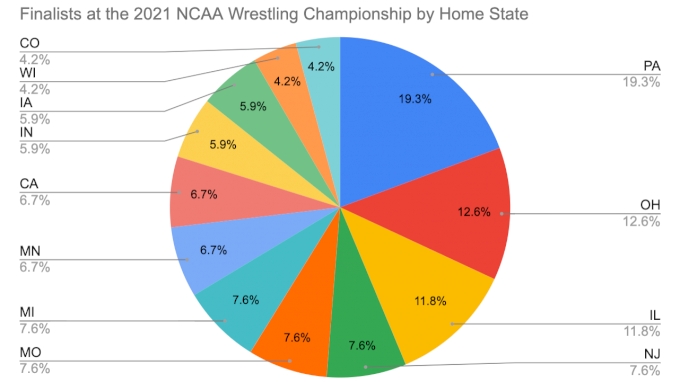
| STATE | FNs | STATE | CHAMPS | ||
| PA | 7 | PA | 2 | S. Lee | |
| IN | 2 | IN | 1 | N. Lee | |
| AZ | 2 | AZ | 1 | RBY | |
| TX | 1 | TX | 1 | Ferrari | |
| OK | 1 | OH | 1 | Carr | |
| OH | 1 | NJ | 1 | Griffith | |
| NY | 1 | MN | 1 | Gable | |
| NJ | 1 | MD | 1 | Brooks | |
| MO | 1 | IL | 1 | AOC | |
| MN | 1 | ||||
| MD | 1 | ||||
| IL | 1 |
How do 2021's results compare to state's historical performances? The numbers below are from 2010 to 2019 and show the total, average and percentage increase or decrease from 2021.
| STATE | AAs | 10yr AVG | 2021 | INC/DEC |
| AL | 1 | 0.1 | 1 | 900% |
| WI | 8 | 0.8 | 4 | 400% |
| AZ | 4 | 0.4 | 2 | 400% |
| VA | 10 | 1.0 | 3 | 200% |
| IN | 18 | 1.8 | 5 | 178% |
| NC | 5 | 0.5 | 1 | 100% |
| IL | 44 | 4.4 | 7 | 59% |
| TX | 7 | 0.7 | 1 | 43% |
| GA | 7 | 0.7 | 1 | 43% |
| PA | 126 | 12.6 | 17 | 35% |
| OK | 24 | 2.4 | 3 | 25% |
| MO | 32 | 3.2 | 4 | 25% |
| WA | 8 | 0.8 | 1 | 25% |
| MN | 39 | 3.9 | 4 | 3% |
| MI | 40 | 4.0 | 4 | 0% |
| ID | 10 | 1.0 | 1 | 0% |
| CO | 23 | 2.3 | 2 | -13% |
| CA | 47 | 4.7 | 4 | -15% |
| UT | 12 | 1.2 | 1 | -17% |
| MD | 12 | 1.2 | 1 | -17% |
| FL | 12 | 1.2 | 1 | -17% |
| NY | 38 | 3.8 | 3 | -21% |
| OR | 13 | 1.3 | 1 | -23% |
| NJ | 59 | 5.9 | 4 | -32% |
| OH | 84 | 8.4 | 3 | -64% |
| IA | 47 | 4.7 | 1 | -79% |
| STATE | R16s | 10yr AVG | 2021 | INC/DEC |
| AL | 2 | 0.2 | 1 | 400% |
| AZ | 6 | 0.6 | 2 | 233% |
| MT | 7 | 0.7 | 2 | 186% |
| WI | 20 | 2 | 5 | 150% |
| WY | 4 | 0.4 | 1 | 150% |
| NM | 4 | 0.4 | 1 | 150% |
| GA | 22 | 2.2 | 4 | 82% |
| IN | 41 | 4.1 | 7 | 71% |
| MO | 53 | 5.3 | 9 | 70% |
| TX | 12 | 1.2 | 2 | 67% |
| ND | 7 | 0.7 | 1 | 43% |
| VA | 21 | 2.1 | 3 | 43% |
| OR | 30 | 3 | 4 | 33% |
| MI | 73 | 7.3 | 9 | 23% |
| IL | 115 | 11.5 | 14 | 22% |
| MN | 66 | 6.6 | 8 | 21% |
| FL | 34 | 3.4 | 4 | 18% |
| KS | 17 | 1.7 | 2 | 18% |
| CO | 44 | 4.4 | 5 | 14% |
| WV | 9 | 0.9 | 1 | 11% |
| CT | 9 | 0.9 | 1 | 11% |
| UT | 19 | 1.9 | 2 | 5% |
| OH | 158 | 15.8 | 15 | -5% |
| CA | 86 | 8.6 | 8 | -7% |
| PA | 250 | 25 | 23 | -8% |
| NC | 12 | 1.2 | 1 | -17% |
| IA | 89 | 8.9 | 7 | -21% |
| NJ | 119 | 11.9 | 9 | -24% |
| OK | 43 | 4.3 | 3 | -30% |
| ID | 15 | 1.5 | 1 | -33% |
| MD | 24 | 2.4 | 1 | -58% |
| WA | 26 | 2.6 | 1 | -62% |
| NY | 84 | 8.4 | 3 | -64% |
Worth keeping in mind that 2021numbers are likely slightly down for the northeast due to the Ivies not competing this season.
Now let's look at numbers by conference. Yeah! Let's do it!
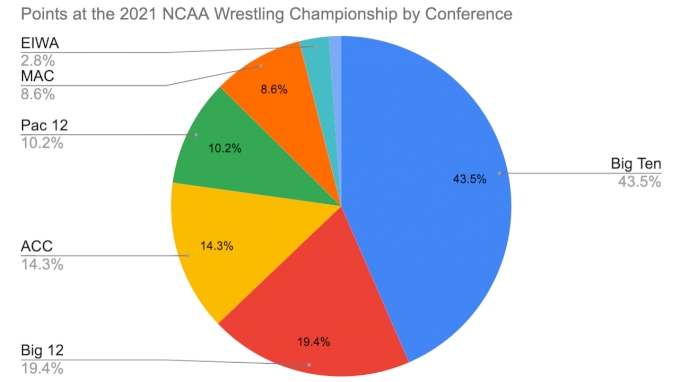
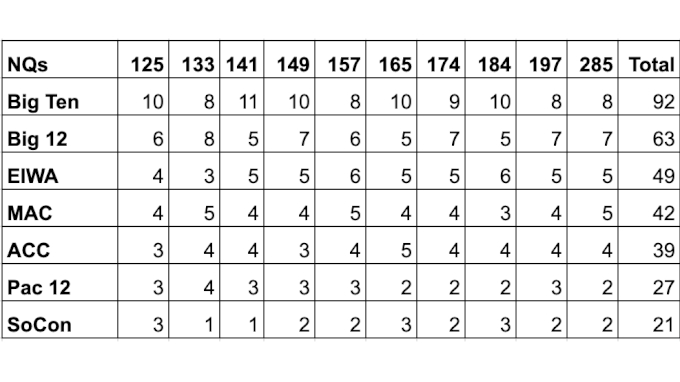
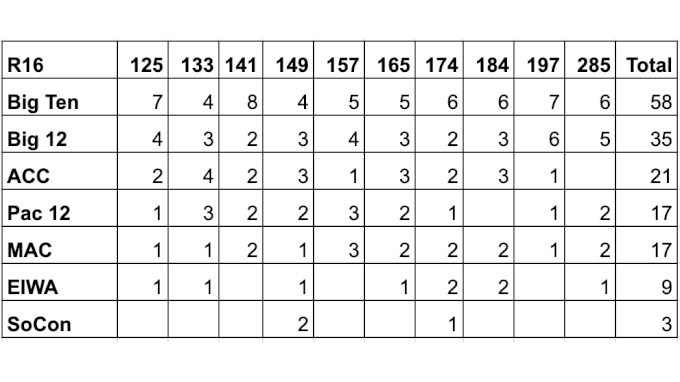
Same numbers hold as we see the ACC punching above it's weight with more Round of 16 finishers per team than the Big 12 and nearly as many per school as the Big Ten.
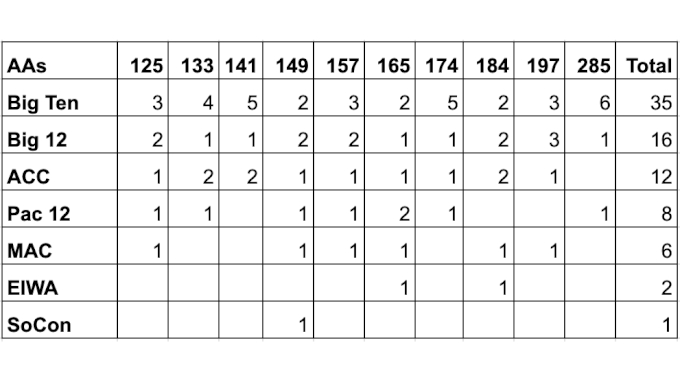
Ditto for All-Americans.
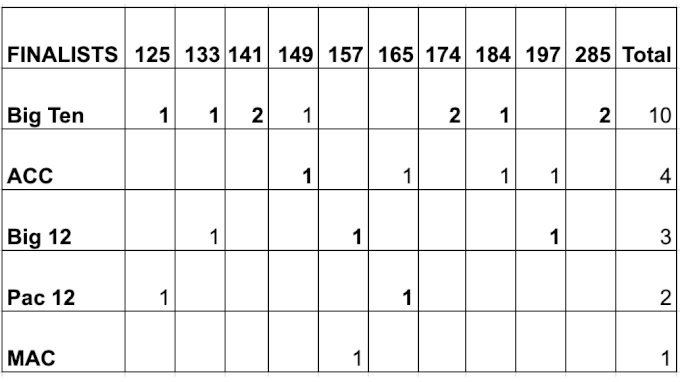
The ACC straight up had more finalists than the Big 12 but the Big 12 has two champs to the ACC's one (Big Ten had 6, Pac-12 has one, with none for the MAC, EIWA and SoCon).
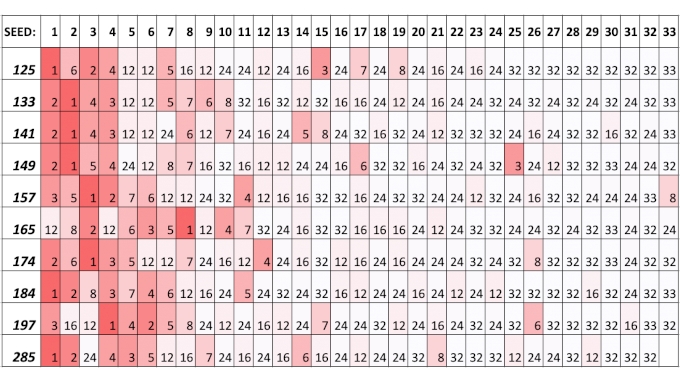
Who over and underperformed? We'll take a deep dive on some prominent teams' performances later (probably not until after Olympic team trials), but for now, we can look how all the different seeds did by weight, with placements color-coded in the cells.
How does that compare to year's past? Below is the number of top 8 seeds who earned All-American honors since 1999. That averages out to 58.5 top 8 seeds a year reaching the medal rounds. 2021 saw 58 top 8 seeds climb podium steps, so just a hair less than average.
| YEAR | Top 8 Seed AAs | Pct |
| 1999 | 59 | 74% |
| 2000 | 61 | 76% |
| 2001 | 53 | 66% |
| 2002 | 58 | 73% |
| 2003 | 58 | 73% |
| 2004 | 60 | 75% |
| 2005 | 57 | 71% |
| 2006 | 63 | 79% |
| 2007 | 55 | 69% |
| 2008 | 66 | 83% |
| 2009 | 58 | 73% |
| 2010 | 57 | 71% |
| 2011 | 64 | 80% |
| 2012 | 57 | 71% |
| 2013 | 59 | 74% |
| 2014 | 54 | 68% |
| 2015 | 53 | 66% |
| 2016 | 54 | 68% |
| 2017 | 62 | 78% |
| 2018 | 57 | 71% |
| 2019 | 64 | 80% |
| AVG | 58.5 | 73.2% |
| 2021 | 58 | 72.5% |
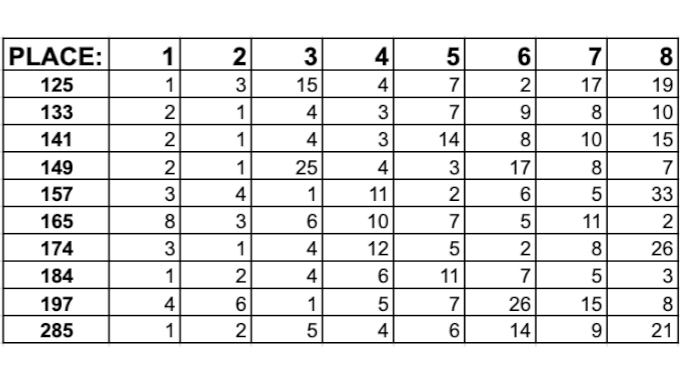
And here's the flip side of the earlier table, where we put the placements in the x-axis and the seed in the cels. Thanks to Twitter friend Pat for the suggestions!
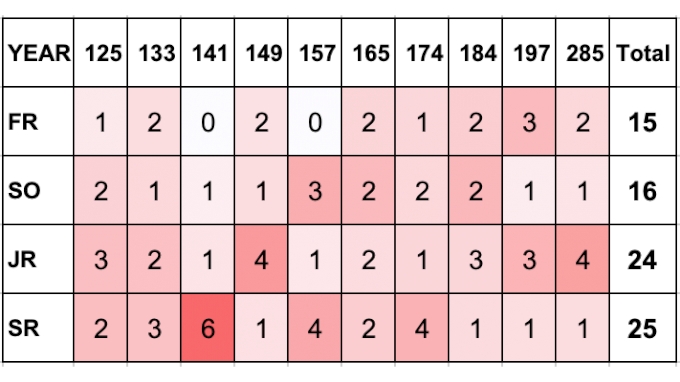
Finally, here are the All-American numbers by year of eligibility, the the darker shades of red in cells where more total tournament points are scored, regardless of final placement.
More stats coming soon. Or later. Heat maps even, who knows!