Unlock this article, live events, and more with a subscription!
Already a subscriber? Log In
Seeding has been a hot topic this week as NCAA brackets were released with some puzzling seeds at several weight classes. Nomad stirred the pot leading into Big Ten’s when he speculated what Big Ten coaches would do when injuries or scheduling quirks created missed matchups within the conferences. The Big Ten doesn’t have some fancy seeding matrix to measure how good a wrestler’s season had been. They seem to do it ‘old school’ and use the often underutilized criteria of common sense to place wrestlers in the bracket.
When I started to dive into this data I thought it was going to show programs that had good and bad performances according to their seed. Specifically, it felt like the Iowa Hawkeyes and Minnesota Golden Gophers had good tournaments, and I expected to find that the Michigan Wolverines had a disappointing tournament when compared to their seeds. The numbers did back those feelings, but not to the extent I expected. The Wolverines were the only team that had the differential that was expected. The Wolverines dropped more than a placement and a half from across the board from their seeded expectation. Unexpectedly the Hawkeyes dropped slightly from their seed average to their placement average, while the Gophers had a slightly positive result.
There are certain things you have to account for when comparing seed vs performance data. The obvious is that when you have a lot of top seeds they can’t outperform their seed. Penn State led the way in this category with four top seeds and three more wrestlers expected to make the finals. You can’t expect the Nittany Lions to score below their seeding expectation of 3.2 when the best that 40% of their lineup can do is equal their seed. The same can be said for the opposite end on the spectrum. When seeding expectations are very low, you can only do better. The Maryland Terrapins almost proved my theory there in correct as they came into the tournament with an average seed of 12.35 and had performance score of 12.15. Youssif Hemida saved the day for the Terrapins by coming into the tournament unseeded and walking away with a third place finish.
A few housekeeping notes to help you following along with the data breakdown. When they only seeded the top 8 I assigned the median of 11.5 to the remaining wrestlers for their seed. When there was not a 9th place bracket round of 12 losers were assigned a place value of 10.5 and the first round consolation losers were assigned a value of 13.5. When the 9th place bracket was used, values of 13.5 and 11.5 were used for losses in the bracket prior to the 9th place bout. This accounts for most of the discrepancies in team score and placement averages. Obviously bonus points were also available to boost the team score to allow teams with an average lower placement to finish higher in the team race.
When looking at the data I broke the Big Ten into the haves (Top 7) and the have nots (Bottom 7). Every team with a seeding average in the top seven placed there in the team score and place average.
| Team | 125 | 133 | 141 | 149 | 157 | 165 | 174 | 184 | 197 | 285 | AVG |
|---|---|---|---|---|---|---|---|---|---|---|---|
| Penn State Seeds | 12 | 4 | 2 | 6 | 1 | 1 | 1 | 2 | 1 | 2 | 3.2 |
| Penn State Results | 13.5 | 5 | 3 | 6 | 1 | 2 | 1 | 2 | 1 | 1 | 3.55 |
| Ohio State Seeds | 8 | 5 | 3 | 2 | 7 | 6 | 6 | 1 | 2 | 5 | 4.5 |
| Ohio State Results | 9 | 2 | 1 | 2 | 7 | 6 | 6 | 1 | 2 | 10.5 | 4.65 |
| Iowa Seeds | 2 | 2 | 7 | 3 | 5 | 2 | 10 | 5 | 3 | 8 | 4.7 |
| Iowa Results | 2 | 4 | 7 | 3 | 4 | 1 | 10 | 5 | 3 | 10.5 | 4.95 |
| Minnesota Seeds | 3 | 6 | 6 | 4 | 6 | 8 | 5 | 12 | 7 | 1 | 5.8 |
| Minnesota Results | 3 | 3 | 4 | 5 | 6 | 9 | 3 | 10 | 10.5 | 2 | 5.55 |
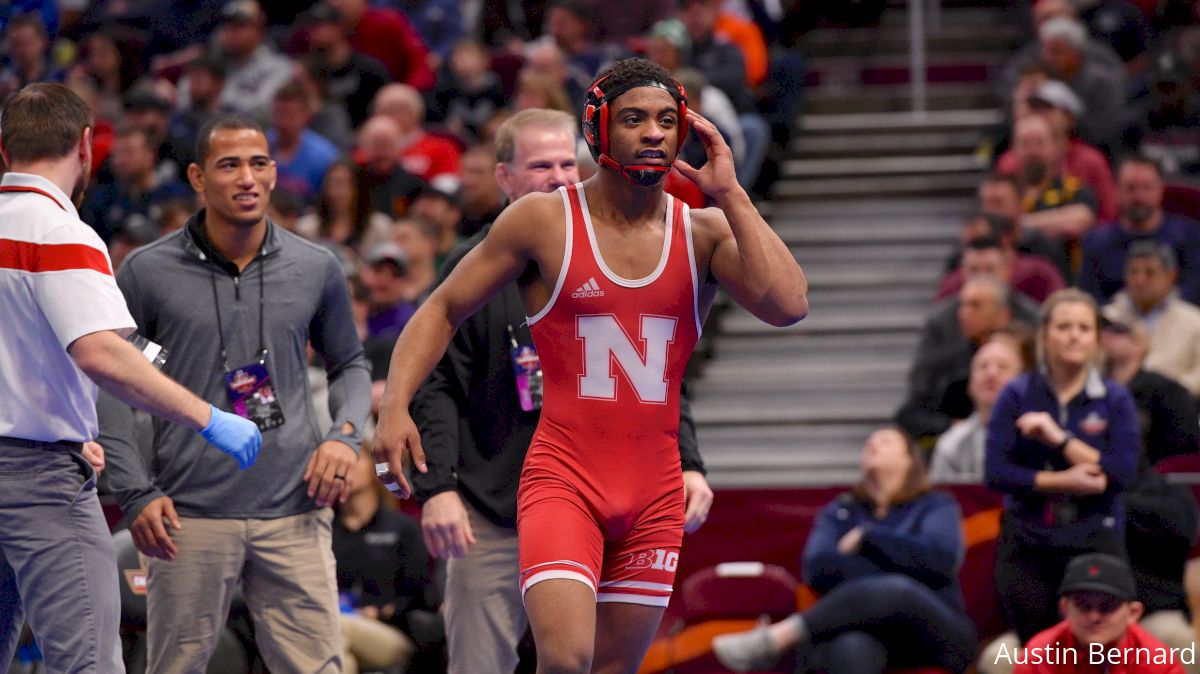
| Nebraska Seeds | 7 | 13 | 8 | 11.5 | 2 | 4 | 4 | 3 | 5 | 7 | 6.45 |
| Nebraska Results | 11.5 | 9 | 2 | 10.5 | 2 | 5 | 4 | 4 | 4 | 6 | 5.8 |
| Michigan Seeds | 6 | 1 | 5 | 8 | 4 | 5 | 2 | 7 | 6 | 3 | 4.7 |
| Michigan Results | 7 | 6 | 5 | 8 | 3 | 3 | 2 | 11.5 | 10.5 | 7 | 6.3 |
| Wisconsin Seeds | 13.5 | 11 | 4 | 5 | 13 | 3 | 7 | 6 | 11.5 | 4 | 7.8 |
| Wisconsin Results | 11.5 | 11.5 | 6 | 4 | 11 | 4 | 8 | 8 | 6 | 4 | 7.4 |
Nebraska won the top half differential with a positive score of 0.65. That means they outperformed their seed across the board by just over half a placement. Michigan was the loser of the haves dropping 1.6 from their average seed to placement. Chad Red made for all of Nebraska’s gain finishing second from the number 8 seed. Across the rest of the board the Huskers held serve and had an almost identical seed to placement score when Red was removed from their data set.
Michigan dropped most of their placement points in the back half of their line-up. Between Embree, Striggow, and Paris they dropped an average of 4 ⅓ places from their seeding projections. When you compound that with Micic medical forfeiting to sixth place from the top seed, the Wolverines had, by far, the worst tournament differential.
Penn State, Ohio State, Iowa, and Minnesota all had consistent results within the expected margins. I was hoping to see a team show that they were consistently better against the field at the end of the year when compared to the postseason. That didn’t happen. The seeding was very accurate, as it should be at conferences when a lot of the matchups took place during the regular season. You’re not left comparing resumes with very few common opponents.
| Team | 125 | 133 | 141 | 149 | 157 | 165 | 174 | 184 | 197 | 285 | AVG |
|---|---|---|---|---|---|---|---|---|---|---|---|
| Rutgers Seeds | 13 | 3 | 9 | 1 | 10 | 12 | 9 | 9 | 11.5 | 11.5 | 8.9 |
| Rutgers Results | 10 | 1 | 9 | 1 | 8 | 13.5 | 9 | 6 | 13.5 | 10.5 | 8.15 |
| Northwestern Seeds | 1 | 10 | 14 | 7 | 3 | 10 | 14 | 14 | 11.5 | 6 | 9.05 |
| Northwestern Results | 1 | 10 | 13.5 | 7 | 5 | 8 | 13.5 | 13.5 | 10.5 | 5 | 8.7 |
| Purdue Seeds | 9 | 7 | 10 | 11.5 | 9 | 14 | 3 | 8 | 4 | 11.5 | 8.7 |
| Purdue Results | 8 | 7 | 10 | 13.5 | 9 | 11 | 5 | 7 | 5 | 8 | 8.35 |
| Illinois Results | 5 | 8 | 1 | 11.5 | 8 | 9 | 11 | 4 | 11.5 | 11.5 | 8.05 |
| Illinois Results | 5 | 8 | 8 | 13.5 | 10 | 10 | 11.5 | 3 | 10.5 | 13.5 | 9.3 |
| Indiana Seeds | 10 | 12 | 11 | 11.5 | 11 | 7 | 12 | 11 | 11.5 | 11.5 | 10.85 |
| Indiana Results | 4 | 13.5 | 11.5 | 10.5 | 11.5 | 7 | 11.5 | 11.5 | 8 | 10.5 | 9.95 |
| Michigan State Seeds | 4 | 9 | 12 | 11.5 | 12 | 13 | 8 | 10 | 8 | 11.5 | 9.9 |
| Michigan State Results | 6 | 11.5 | 11.5 | 10.5 | 13.5 | 11.5 | 7 | 9 | 7 | 13.5 | 10.1 |
| Maryland Seeds | 11 | 14 | 13 | 11.5 | 14 | 11 | 13 | 13 | 11.5 | 11.5 | 12.35 |
| Maryland Results | 13.5 | 13.5 | 13.5 | 10.5 | 13.5 | 13.5 | 13.5 | 13.5 | 13.5 | 3 | 12.15 |
The bottom half of the Big Ten conference had similar results to the top half when comparing seeding expectations to the actual placements. Indiana and Rutgers won the differential race in the have nots category. Rutgers did it without an outlier performance in their lineup. They consistently beat their seed by a small margin throughout the lineup. Elijah Oliver was the breakout performance that carried the Hoosiers to a solid positive score. Oliver came in as the 10 seed at 125 pounds and left with an automatic qualifying performance of fourth. Indiana still had a positive score when you remove Oliver’s performance as the hit their mark up and down the lineup with a slight positive differential.
Illinois was the differential loser from the bottom half of the conference. 141 pounds was one of the weights that the data seemed to be misleading from expectation. Nick Lee and Joey McKenna were nationally ranked ahead of Michael Carr, but Carr did not lose during the Big Ten regular season. Carr correctly received the number one seed, but couldn’t live up to that billing. Carr had a regular season win over Chad Red reversed in the quarterfinal and dropped two more en route to an 8th place finish. This accounted for a large portion of the -1.25 differential for the Illini. Even when you remove the outlier performance from Carr, the Illini still had the second worst differential of the tournament.
When I began to dive into the data I expected results to show some wild swings away from the seeding average of a few teams, that didn’t happen. Tournament results were pretty consistent with regular season results and seed held in large part within normal margins. Kudos to the seeding committee.
| Team | Seed Avg | Place Avg | Differential | Team Scores |
|---|---|---|---|---|
| Penn State | 3.2 | 3.55 | -0.33 | 157.5 |
| Ohio State | 4.5 | 4.65 | -0.15 | 122.5 |
| Iowa | 4.7 | 4.95 | -0.25 | 107.5 |
| Minnesota | 5.8 | 5.55 | 0.25 | 103.5 |
| Nebraska | 6.45 | 5.8 | 0.65 | 95.5 |
| Michigan | 4.7 | 6.3 | -1.6 | 78.5 |
| Wisconsin | 7.8 | 7.4 | 0.4 | 76 |
| Rutgers | 8.9 | 8.15 | 0.75 | 53.5 |
| Northwestern | 9.05 | 8.7 | 0.35 | 51.5 |
| Purdue | 8.7 | 8.35 | 0.35 | 42 |
| Illinois | 8.05 | 9.3 | -1.25 | 39.5 |
| Indiana | 10.85 | 9.95 | 0.9 | 33 |
| Michigan State | 9.9 | 10.1 | -0.2 | 29.5 |
| Maryland | 12.35 | 12.15 | 0.2 | 13 |