State Wars: Who Has The Most NCAA Finalists?
State Wars: Who Has The Most NCAA Finalists?
Comparison by state of the NCAA Division I finalists over the past two decades.

Unlock this article, live events, and more with a subscription!
Already a subscriber? Log In
The state debate will rage on forever. Pick the metric that is most beneficial for your favorite state and run with it. At the high school level, there isn’t a great objective measurement. You either have to use a tournament that has varying levels of participation by state, or rankings that are subjective. Fortunately at the highest level of folkstyle wrestling has the NCAA Division I Championships that gives us an objective way to measure.
Once you decide you're going to use the NCAA Championships, you have to decide what accomplishment you want to dissect by state. Qualifiers? All-Americans? Finalists? Champions? Here we are going to look at the latter from the past two decades. The larger sample sets of qualifiers and All-Americans are often analyzed. However, when NCAA coaches are evaluated, the NCAA Championships performance is pretty high on the list. Big points scored by finalists are very important. Just a few big-point scorers can earn a team trophy and draw positive reviews from the administration. So you see why finalists are coveted by coaching staffs around the country.
The most elite metric to use is NCAA champions. I thought this small data set would bring in some variance and power states might not assert their dominance like they do with the larger sample sizes. Even from a Pennsylvania lens, I have always thought about the dominance the state has in volume of top-tier competitors that qualify and earn All-American honors. I didn’t expect the results to be so dramatic for the Keystone State over the competition. After looking at the data more closely, I felt foolish for not knowing how dominant Pennsylvania has been in the last two decades at producing NCAA finalists and more so, champions.
Think about this list of multiple time champions over the past two decades for Pennsylvania: Greg Jones 3x, Jake Herbert 2x, Jordan Oliver 2x, Quentin Wright 2x, Ed Ruth 3x, Zain Retherford 3x, Jason Nolf 3x, Vincenzo Joseph 2x, Spencer Lee 2x. I should have understood just how many titles have been won by Pennsylvania natives.
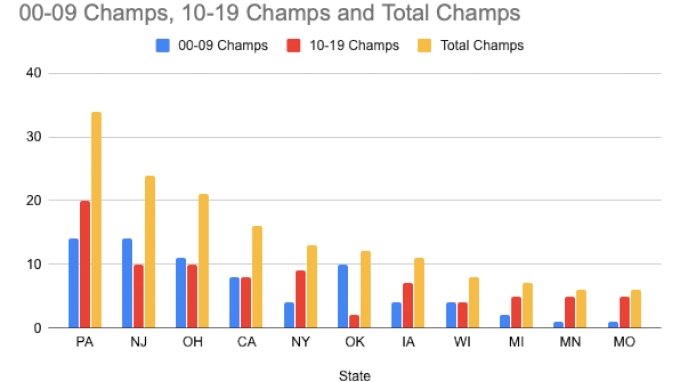
The usual suspects are there when looking at the champions. New Jersey, Ohio, California leading the way behind Pennsylvania. New York and Oklahoma had quite a role reversal in the two decades. New York Edged Oklahoma out in the overall total, but the difference a decade made was huge. For New York the explanation is easy, Kyle Dake and Yianni Diakomihalis.
Oklahoma is strange. They have disappeared as a national power when using NCAA finalists as your metric. Multiple-time finalists and champions were the norm from 2000-2009. Michael Lightner, Teyon Ware, Johnny Hendricks, and Mark Perry led the way in the first decade of the century. In total Oklahoma had 16 finalists and 10 champions in the decade. The top-level talent disappears from Oklahoma's totals in the next decade. Chris Perry was the only NCAA Champion in the decade, doing it twice. In 2019 Daton Fix and Derek White helped the cause with second-place finishes. It was an output only equal to 25% of the decade before when counting finalists. They moved from the fourth-best state to outside the top 10. Overall a sixth-place total seems in-line with the population, and wrestling tradition of Oklahoma. However, Bo Nickal single-handedly put Texas ahead of Oklahoma on the 2010-19 table.
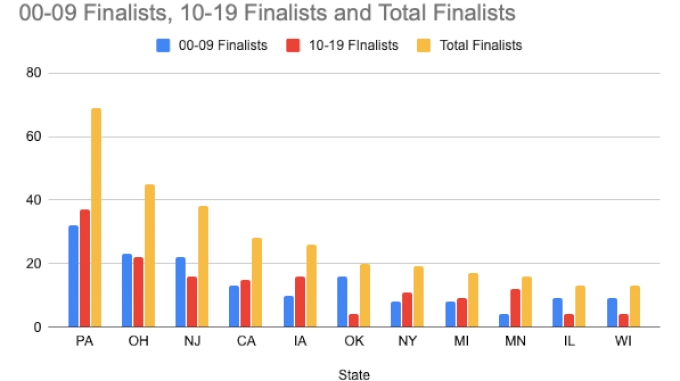
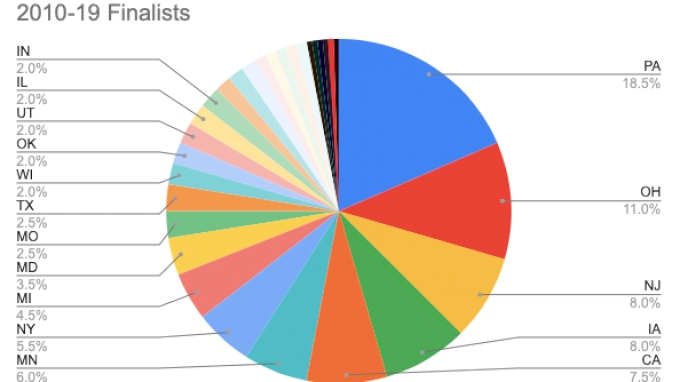
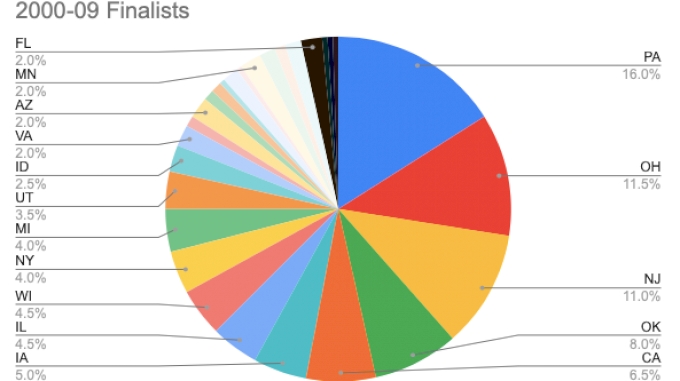
When comparing the overall landscape it’s hard not to notice the power states covering a large percentage of the pie graphs. The top ten states for each decade make up approximately 75% of the finalists. This is an incredible amount of team points coming from the power states. Pennsylvania accounted for 18.5% and 16% of all finalists in the two decades. That trumps the dominance of the All-American totals they put up that are thought to be so outrageous. 17.25% of the All-American totals would be 13.8 All-Americans per year. That is well ahead of the 12.9 Pennsylvania averaged from 2010-19.
In conclusion, your power states have those reputations for a reason. Whether you are looking at Division I roster spots, starters, NCAA qualifiers, All-Americans, finalists, or champions the power states are going to dominate the statistical categories.
Related Content
 70 kg Cons 16 #2 - Boeden Greenley, Bison Wrestling Club vs Isaias Jimenez, Valiant Wrestling Club
Apr 27, 2024
 79 kg Cons 16 #2 - Christopher Mance III, Level Up Wrestling Center vs Lorenzo Norman, New Jersey
Apr 27, 2024
 79 kg Cons 16 #2 - Gavin Ricketts, Kentucky vs Silas Dailey, Askren Wrestling Academy
Apr 27, 2024
 86 kg Cons 16 #2 - Blake Jouret, Beaver Wrestling Club vs Hoke Hogan, Georgia
Apr 27, 2024
 65 kg Cons 16 #2 - Jayden Scott, Tar Heel Wrestling Club vs Daniel Zepeda, Gilroy High School Wrestling
Apr 27, 2024
 74 kg Cons 16 #2 - Dillon Carlson, Golden Pride Wrestling Club vs Joseph Blaze, Boilermaker RTC
Apr 27, 2024
 70 kg Cons 16 #2 - Brandon Cannon, Ohio Regional Training Center vs Dylan Evans, Pittsburgh Wrestling Club
Apr 27, 2024
 86 kg Cons 16 #2 - Leimana Fager, Charger Wrestling Club vs Jersey Robb, Cowboy RTC
Apr 27, 2024
 125 kg Cons 16 #1 - Winston McBride, Wyoming Wrestling Reg Training Ctr vs Brayden Hill, Juic3 Acad3my Wrestling
Apr 27, 2024