2020 PIAA Heat Maps
2020 PIAA Heat Maps
Check out where the talent is located in the state of Pennsylvania and find out which regions and districts are best.

Unlock this article, live events, and more with a subscription!
Already a subscriber? Log In
It’s one of the best state tournaments in the country. Some of the best kids in the nation come from all over the state to Hershey. I’m going to use a few tools to see where the best kids come from and what part of the state is the best.
First of all, let’s take a look at the top few team scores.
AA
1. Notre Dame GP 114
2. Montoursville 103
3. Southern Columbia 98.5
AAA
1. Bethlehem Catholic 110.5
2. Nazareth 88.5
3. Waynesburg 88
Now, a wonderful peach of technology...heat maps! The first map represents all of the state placers combined across both classes. Hot spots are accumulated by mapping out tournament placement points from every state placer. Meaning, champions receive 20 points and 8th place finishers receive 5.5. The more points in an area, the hotter the spot.
Both Classes
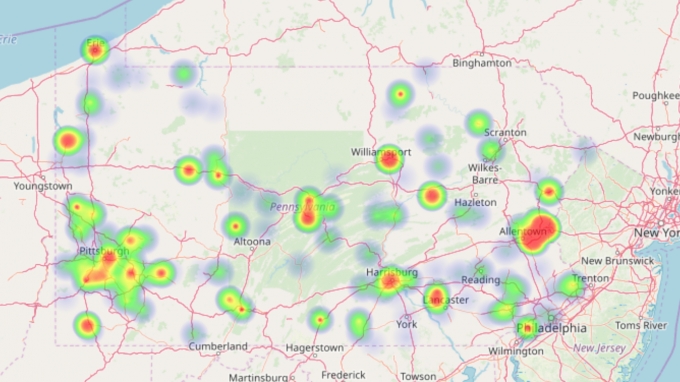
Outside of the north central area, the talent is pretty well spread out throughout the entire state with the strongest cluster coming out of the Lehigh Valley.
AA
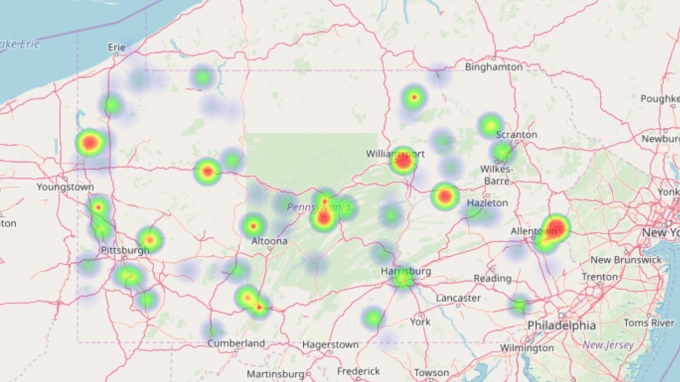
Once again the Lehigh Valley is well represented with Notre Dame. Central PA is represented by St. Joseph’s Catholic and champion Gage McClenahan from Bald Eagle Area and the Williamsport area gets a boost with Montoursville and Southern Columbia.
AAA
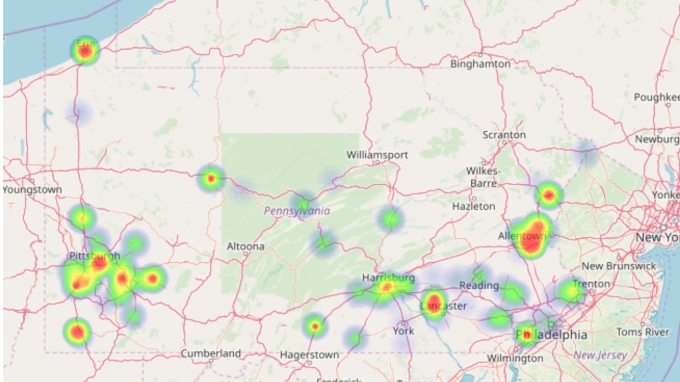
Due to Bethlehem Catholic, Nazareth, Easton, and Northampton the Lehigh Valley has the best cluster once again.
Regional Breakdown
If you’ve ever wondered what Region (the state qualifying tournament) is the toughest, look no further. I assigned placement points to every placer, just like in the heat maps above to show which regions scored the most.
AA
| Region | Champs | Placers | Placement Points |
| Southwest | 6 | 38 | 456 |
| Northeast | 4 | 23 | 282 |
| Northwest | 2 | 26 | 282 |
| Southeast | 2 | 24 | 282 |
Oddly enough, the Northeast, Northwest, and Southeast Regions all scored the same amount of points. The Southwest Region was head and shoulders above the rest.
AAA
| Region | Champs | Placers | Placement Points |
| Southwest | 6 | 36 | 468 |
| Northeast | 3 | 24 | 272 |
| Southeast | 1 | 19 | 204 |
| Southcentral | 2 | 18 | 192 |
| Northwest | 2 | 15 | 166 |
Just like AA, the Southwest Region was head and shoulders above the rest. The Southwest Region had double the amount of champs as second place Northeast and almost twice as many placement points.
Champions By District
AA
D4 - 4 champs
D6 - 4 champs
D11 - 2 champ
D5 - 1 champ
D7 - 1 champ
D9 - 1 champ
AAA
D7 - 6 champs
D11 - 3 champs
D3 - 2 champs
D1 - 1 champ
D9 - 1 champ
D10 - 1 champ