Breaking Down The 2018, 2017, & 2016 High School Big Boards
Breaking Down The 2018, 2017, & 2016 High School Big Boards
We dig into the 2018, 2017 and 2016 high school big boards and analyze the rankings by state and college.
Unlock this article, live events, and more with a subscription!
Already a subscriber? Log In
The final Class of 2018 Big Board has been released. But how do those rankings break down by the home state of the wrestlers and the colleges they committed to? Excellent questions, we will answer them for you!
To allow us to more easily manipulate the data, we assigned points to each ranked recruit. The top recruit on each year's Big Board received 100 points, the #100 recruit received one point, and so on. We analyzed the 2016, 2017, and 2018 Big Boards by home state and the 2017 and 2018 Big Boards by the colleges the recruits committed to at the time the final yearly Big Boards were released.
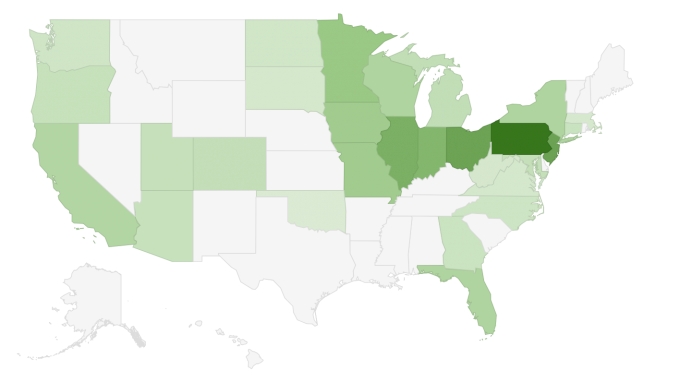
We then produced a heat map by state based on total "recruit points" per year. Below is 2018.
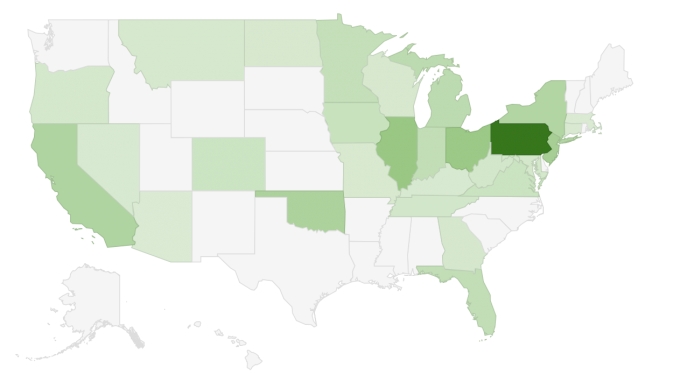
The following map is for 2017.
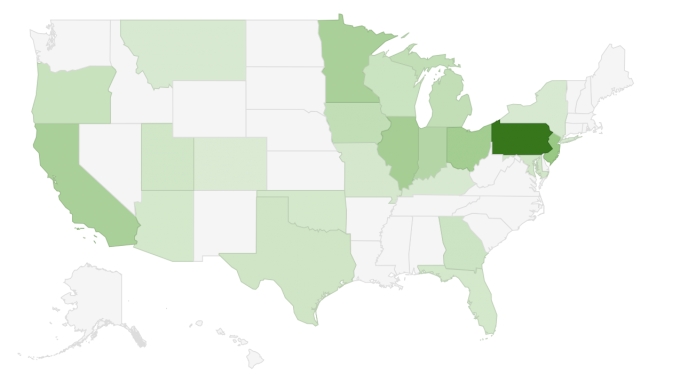
And finally the 2016 map.
To get a better idea of how strengths of each state fluctuated over the last three years, we took the top 10 states by total recruiting points from 2016 through 2018 and graphed each year side by side. That graph is below.
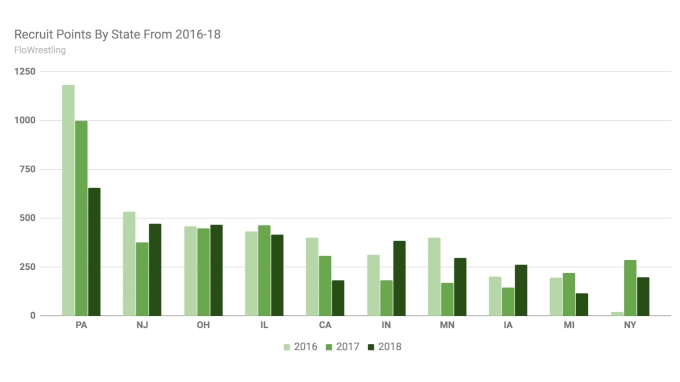
It's no surprise to find Pennsylvania at the top of the recruiting boards. It's a fairly large state and rich in blue-chip high school stars. The trend over the last three years, however, appears to indicate that the Keystone State's dominance is slowly waning or perhaps regressing to the true mean.
The usual suspects round out the rest of the top 10. Notably, New York makes an appearance with two strong years following a relatively meager 2016.
A small state like Iowa, less than one quarter the size of Pennsylvania, would look even more impressive if we broke down the recruiting points per capita, but you'll have to use your imagination for now. Deadlines did not allow for that calculation to be included in this article.
We also wanted to see how colleges did in attracting the best prep wrestlers in 2017 and 2018. Again, a reminder that these numbers are based on commitments at the time the final Big Boards were released. They are not adjusted to take into account late commitments, transfers, etc.
A graph of the top 25 colleges by recruit points produced using the same method as the above graph by state can be found below.
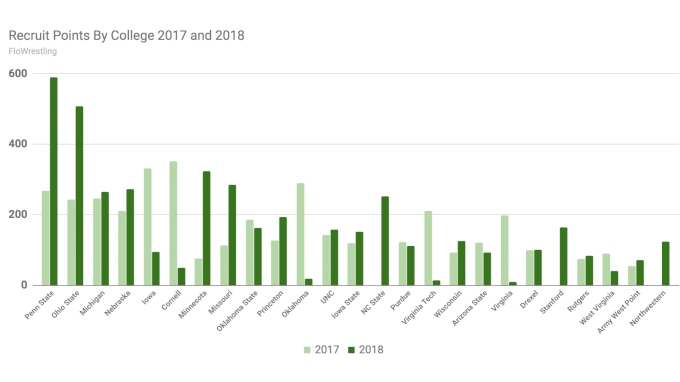
No surprise seeing Penn State and Ohio State at #1 and #2, respectively. Those two collegiate powerhouses separated themselves from the rest of Division I in recruiting this year much as they did in the team race of the 2018 NCAA Championship.
There was evidence of more parity in recruiting in 2017. Cornell and Iowa were #1 and #2, respectively, in the previous season. And Lou Roselli landed an impressive haul in his first crack at recruiting as head coach of the Oklahoma Sooners, coming in at #3 according to these numbers.
And if it's raw data that you're looking for, we got that covered too. Below are all the points for every recruit by state, followed by a table of just the number of individuals on each Big Board by state.
| State | 2016 | 2017 | 2018 | Total |
| PA | 1,184 | 1,000 | 656 | 2,840 |
| NJ | 533 | 376 | 472 | 1,381 |
| OH | 459 | 448 | 468 | 1,375 |
| IL | 434 | 466 | 416 | 1,316 |
| CA | 400 | 307 | 184 | 891 |
| IN | 314 | 182 | 384 | 880 |
| MN | 401 | 171 | 298 | 870 |
| IA | 203 | 146 | 262 | 611 |
| MI | 197 | 220 | 116 | 533 |
| NY | 20 | 288 | 198 | 506 |
| FL | 58 | 182 | 198 | 438 |
| OK | 57 | 334 | 6 | 397 |
| WI | 134 | 45 | 198 | 377 |
| MO | 43 | 39 | 263 | 345 |
| OR | 151 | 63 | 95 | 309 |
| GA | 117 | 59 | 76 | 252 |
| MD | 74 | 68 | 99 | 241 |
| CO | 4 | 120 | 109 | 233 |
| UT | 86 | 96 | 182 | |
| AZ | 56 | 25 | 89 | 170 |
| VA | 128 | 34 | 162 | |
| CT | 33 | 78 | 111 | |
| WV | 74 | 30 | 104 | |
| ND | 48 | 53 | 101 | |
| TX | 90 | 90 | ||
| TN | 77 | 77 | ||
| MT | 18 | 54 | 72 | |
| NC | 61 | 61 | ||
| WA | 55 | 55 | ||
| KY | 17 | 37 | 54 | |
| MA | 24 | 25 | 49 | |
| NV | 36 | 36 | ||
| SD | 31 | 31 |
| State | 2016 | 2017 | 2018 | Total |
| PA | 18 | 17 | 13 | 48 |
| OH | 11 | 10 | 11 | 32 |
| NJ | 11 | 6 | 8 | 25 |
| IL | 8 | 8 | 7 | 23 |
| CA | 7 | 8 | 5 | 20 |
| IA | 7 | 7 | 5 | 19 |
| MN | 7 | 2 | 6 | 15 |
| IN | 4 | 4 | 5 | 13 |
| MO | 3 | 2 | 7 | 12 |
| MI | 6 | 3 | 3 | 12 |
| WI | 2 | 2 | 5 | 9 |
| NY | 1 | 3 | 5 | 9 |
| FL | 2 | 4 | 3 | 9 |
| OK | 2 | 5 | 1 | 8 |
| CO | 1 | 3 | 2 | 6 |
| GA | 2 | 2 | 1 | 5 |
| OR | 2 | 1 | 1 | 4 |
| VA | 2 | 1 | 3 | |
| UT | 1 | 2 | 3 | |
| MD | 1 | 1 | 1 | 3 |
| AZ | 1 | 1 | 1 | 3 |
| WV | 1 | 1 | 2 | |
| TN | 2 | 2 | ||
| ND | 1 | 1 | 2 | |
| MT | 1 | 1 | 2 | |
| MA | 1 | 1 | 2 | |
| KY | 1 | 1 | 2 | |
| CT | 1 | 1 | 2 | |
| WA | 1 | 1 | ||
| TX | 1 | 1 | ||
| SD | 1 | 1 | ||
| NV | 1 | 1 | ||
| NC | 1 | 1 |
And below are the total points for every college, followed by total number of individual recruits.
| College | 2017 | 2018 | Total |
| Penn State | 268 | 590 | 858 |
| Ohio State | 244 | 507 | 751 |
| Michigan | 247 | 265 | 512 |
| Nebraska | 210 | 272 | 482 |
| Iowa | 331 | 95 | 426 |
| Cornell | 351 | 50 | 401 |
| Minnesota | 76 | 323 | 399 |
| Missouri | 113 | 285 | 398 |
| Oklahoma State | 186 | 163 | 349 |
| Princeton | 128 | 194 | 322 |
| Oklahoma | 290 | 19 | 309 |
| UNC | 142 | 158 | 300 |
| Iowa State | 119 | 152 | 271 |
| NC State | 253 | 253 | |
| Purdue | 122 | 111 | 233 |
| Virginia Tech | 210 | 14 | 224 |
| Wisconsin | 93 | 125 | 218 |
| Arizona State | 121 | 93 | 214 |
| Virginia | 199 | 9 | 208 |
| Drexel | 99 | 101 | 200 |
| Stanford | 164 | 164 | |
| Rutgers | 75 | 84 | 159 |
| West Virginia | 90 | 40 | 130 |
| Army West Point | 55 | 71 | 126 |
| Northwestern | 124 | 124 | |
| Oregon St | 112 | 112 | |
| Edinboro | 65 | 41 | 106 |
| North Dakota St | 48 | 53 | 101 |
| Binghamton | 100 | 100 | |
| Penn | 21 | 75 | 96 |
| Pitt | 71 | 22 | 93 |
| SIUE | 87 | 87 | |
| Navy | 87 | 87 | |
| Harvard | 87 | 87 | |
| Brown | 79 | 79 | |
| Lincoln | 78 | 78 | |
| UNI | 15 | 57 | 72 |
| South Dakota State | 27 | 42 | 69 |
| Rider | 69 | 69 | |
| Cleveland St | 43 | 24 | 67 |
| Ohio | 58 | 7 | 65 |
| Chattanooga | 56 | 5 | 61 |
| Maryland | 60 | 60 | |
| Central OK | 50 | 50 | |
| Lehigh | 14 | 30 | 44 |
| Fresno State | 13 | 31 | 44 |
| George Mason | 39 | 39 | |
| American | 39 | 39 | |
| Virignia Tech | 38 | 38 | |
| Lock Haven | 37 | 37 | |
| Clarion | 34 | 34 | |
| Gardner-Webb | 29 | 29 | |
| NIU | 28 | 28 | |
| Campbell | 19 | 19 | |
| Michigan St | 11 | 11 | |
| Northern CO | 8 | 8 | |
| Wyoming | 4 | 4 | |
| Old Dominion | 2 | 2 |
| College | 2017 | 2018 | Total |
| Ohio State | 3 | 8 | 11 |
| Penn State | 3 | 7 | 10 |
| Missouri | 3 | 7 | 10 |
| Nebraska | 3 | 5 | 8 |
| Michigan | 4 | 3 | 7 |
| Iowa | 5 | 2 | 7 |
| Cornell | 6 | 1 | 7 |
| Princeton | 2 | 4 | 6 |
| Oklahoma | 4 | 2 | 6 |
| Wisconsin | 2 | 3 | 5 |
| Virginia | 4 | 1 | 5 |
| UNC | 2 | 3 | 5 |
| Purdue | 3 | 2 | 5 |
| NC State | 5 | 5 | |
| Minnesota | 1 | 4 | 5 |
| Iowa State | 3 | 2 | 5 |
| Drexel | 2 | 3 | 5 |
| Virginia Tech | 3 | 1 | 4 |
| Rutgers | 1 | 3 | 4 |
| Oklahoma State | 2 | 2 | 4 |
| Arizona State | 3 | 1 | 4 |
| West Virginia | 2 | 1 | 3 |
| UNI | 2 | 1 | 3 |
| Stanford | 3 | 3 | |
| Ohio | 2 | 1 | 3 |
| Northwestern | 3 | 3 | |
| Harvard | 3 | 3 | |
| Fresno State | 2 | 1 | 3 |
| Brown | 3 | 3 | |
| Army West Point | 2 | 1 | 3 |
| South Dakota State | 1 | 1 | 2 |
| SIUE | 2 | 2 | |
| Pitt | 1 | 1 | 2 |
| Penn | 1 | 1 | 2 |
| Oregon St | 2 | 2 | |
| North Dakota St | 1 | 1 | 2 |
| Lehigh | 1 | 1 | 2 |
| Edinboro | 1 | 1 | 2 |
| Cleveland St | 1 | 1 | 2 |
| Chattanooga | 1 | 1 | 2 |
| Binghamton | 2 | 2 | |
| Wyoming | 1 | 1 | |
| Virginia Tech | 1 | 1 | |
| Rider | 1 | 1 | |
| Old Dominion | 1 | 1 | |
| Northern CO | 1 | 1 | |
| NIU | 1 | 1 | |
| Navy | 1 | 1 | |
| Michigan St | 1 | 1 | |
| Maryland | 1 | 1 | |
| Lock Haven | 1 | 1 | |
| Lincoln | 1 | 1 | |
| George Mason | 1 | 1 | |
| Gardner-Webb | 1 | 1 | |
| Clarion | 1 | 1 | |
| Central OK | 1 | 1 | |
| Campbell | 1 | 1 | |
| American | 1 | 1 |