
My estimable colleague JD Rader has already provided a list of every NCAA qualifier's hometown and high school (which you can find here) and even provided an excellent heat map for wrestling fans to enjoy.
We can pinpoint every qualifier in a map to make it look like the continental USA contracted chicken pox, which is why I call this the Chicken Pox Map.
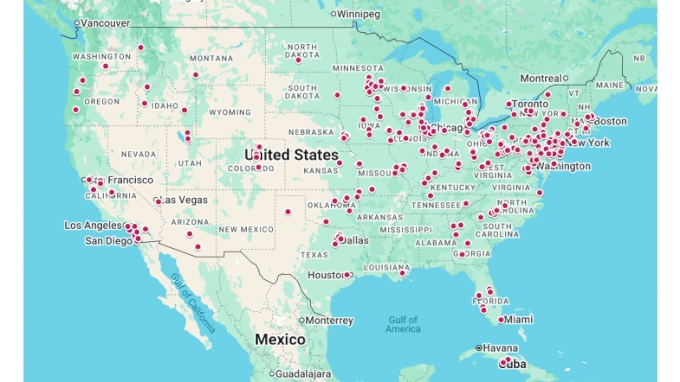
This map also shows the two Cubans who made the tournament but it cuts off Hawaii for spatial reasons, so a special shout-out to the one Hawaiian in the tournament, Kysen Terukina of North Carolina.
But we don't have to stop there. For starters, we can calculate the number of qualifiers per capita for each state. Everyone loves a per capita calculation!
Here's what a heat map by state of the qualifiers per million inhabitants looks like.
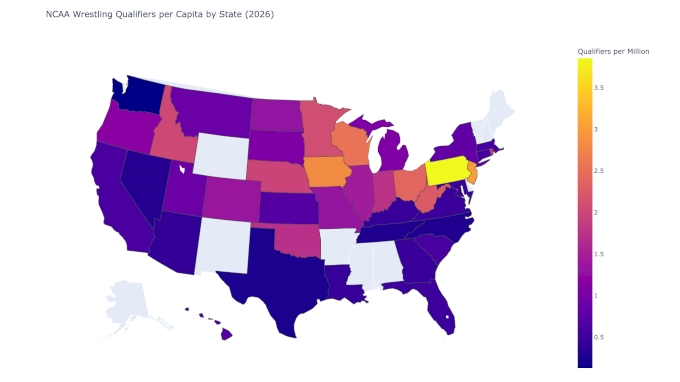
Perhaps surprisingly, Pennsylvania still comes out on top, which happens when you have 50 qualifiers, and the state with the next most qualifiers has 28 (Ohio and New Jersey tied). Often, it's the wrestling fans from the Keystone State that tell me per capita is somehow a flawed measurement, but maybe I'll hear the complaints from different fan bases this year.
But not all qualifiers are created equal. We can project team points scored based on seed (advancement and placement points, not including bonus points) and figure out how many NCAA team points each state is projected to earn, and then make a per capita calculation based on that. Here's what that map looks like.
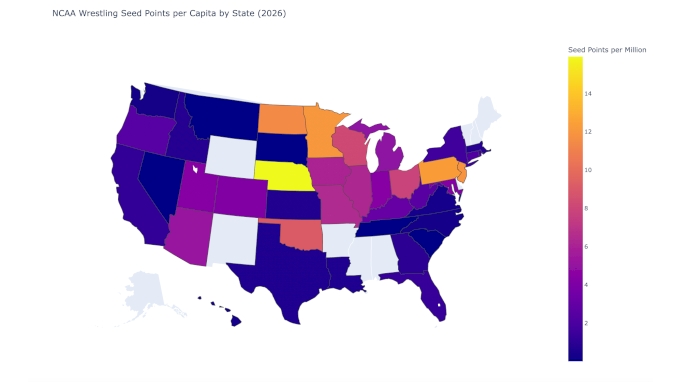
Nebraska comes out on top in this measurement, courtesy of Isaac Trumble and Antrell Taylor, two native Nebraskans and fellow #2 seeds at 285 and 157 respectively.
While we're doing calculations based on projected seed points, we can make this nifty circle map.
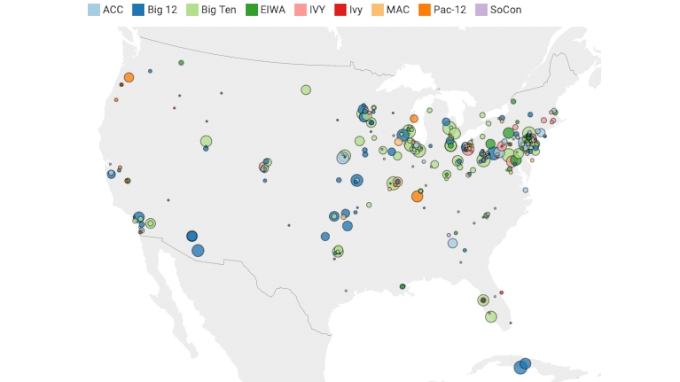
Each circle represents the hometown of a qualifier. The larger the circle the more projected team points based on seed at the NCAAs.
By the way, we're using the hometown that is listed in each athlete's bio page) There are often quibbles and objections about some of the cities listed, but rather than litigating every single hometown and splitting hairs over where someone lived for however many years, we're just sticking with what's on the school website. It's not a perfect system but it's what we're using!
We can also make this spike map using projected NCAA points based on seeds.
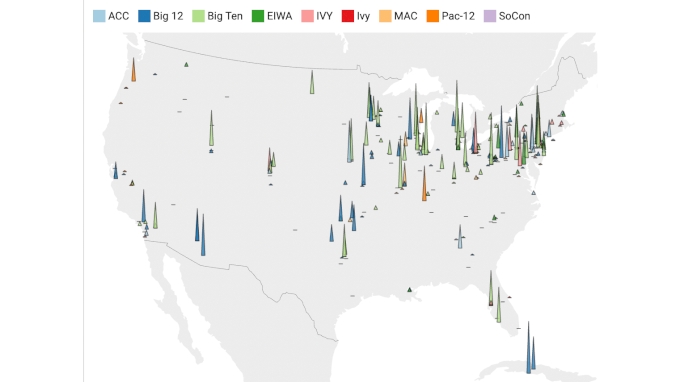
I also color-coded the last two maps by conference. The fact that you can't really tell which conferences are more predominant in different parts of the country speaks to how most programs recruit nationally these days.
Another topic that comes up that I thought I'd use math to solve is to find a major city that most qualifiers will be able to drive to in six hours. This would make the most economic sense to allow for more friends and family to see the qualifiers at the tournament.
According to the computer program I asked to calculate the answer, Pittsburgh, PA is within a six hour drive (ie 400 miles) from about 150 qualifiers, the most of any major city. Coming in a close second is Cleveland, with 145 qualifiers. Columbus, Philadelphia, Indianapolis and Chicago are also all within a days drive of at least 100 qualifiers.
While Kansas City was a surperb host and the city is located towards the geographic center of the continental USA, it's not all that close to where a lot of qualifiers are from.
For what it's worth, I also asked AI to plot the biggest city near all the schools that qualified at least one wrestler for NCAAs and it told me Missouri. Also, I'm not trying to say Kansas City, or really any city, shouldn't host the NCAAs. Everyone can host! Put in a bid and see if the NCAA accepts it! Any location (practically) is fine with me!
Finally, some states are up and some are on a downward trend with regards to national qualifiers. To find out which states are trending one direction or another, I took the average number of qualifiers for each state from 2006-2010 and compared it to the average number of qualifiers from 2022-2026. I also only compared the top 23 states when it came to qualifiers. All those limits were picked arbitrarily, and honestly without too much consideration.
Anyway, the state that dropped the most was Pennsylvania, which went from 51.6 qualifiers to 45.2, which is the most in total numbers but not as a percentage. Washington and Ohio also saw noticeable drops between eras.
On the plus side, Illinois saw the most gains, going from 16.8 to 25.8. Minnesota and Georgia also experienced big gains. As did Wisconsin, but from 2015 to 2019, when they averaged 4 qualifiers per year, as opposed to the last five years, when they averaged 11.6.
Below are all the numbers for you to peruse at your leisure.
| STATE | 2006-10 | 2022-26 | Difference |
|---|---|---|---|
| IL | 16.8 | 25.8 | 9 |
| MN | 6.4 | 13.4 | 7 |
| GA | 1.8 | 7.4 | 5.6 |
| MO | 5.8 | 9.6 | 3.8 |
| WI | 8 | 11.6 | 3.6 |
| OK | 7.6 | 9.8 | 2.2 |
| CO | 6.4 | 8.6 | 2.2 |
| IN | 8.6 | 10.4 | 1.8 |
| FL | 8.2 | 10 | 1.8 |
| NC | 4.6 | 4.4 | -0.2 |
| MI | 14.6 | 13.8 | -0.8 |
| VA | 6.6 | 5.8 | -0.8 |
| NJ | 27.6 | 26.8 | -0.8 |
| KS | 4.8 | 3.4 | -1.4 |
| UT | 4.6 | 2.6 | -2 |
| OR | 5.8 | 3 | -2.8 |
| IA | 15.6 | 12.4 | -3.2 |
| MD | 6.2 | 2.8 | -3.4 |
| NY | 19.8 | 16.4 | -3.4 |
| CA | 24.4 | 20.6 | -3.8 |
| OH | 29.8 | 25.4 | -4.4 |
| WA | 7.8 | 1.8 | -6 |
| PA | 51.6 | 45.2 | -6.4 |
That's all the number crunching I've done so far, but there's still plenty of time between now and the tournament to crunch some more, so feel free to send me suggestions on other topics to consider!