How Many Points Will Each Conference Score At NCAAs?
How Many Points Will Each Conference Score At NCAAs?
How many points will the teams in each conference cumulatively score at 2024 NCAAs? What about in 2025? And how does that compare to the recent past?

We've already shown you how many points each college wrestling team will score at the 2024 NCAA Championships based on seeds (click here!), but what about the number of points each entire conference will score, also based on the seeds?
More NCAA content: Qualifiers by State | Qualifiers by School
Good question, read on and we'll show you!
2024
We used the projected finishes based on seeds and added up approximate advancement and placement points but did not factor in potential bonus points. That produced the following table for this year's championship.
| Conference | Points |
|---|---|
| Big Ten | 401.5 |
| Big 12 | 275.0 |
| EIWA | 157.5 |
| ACC | 145.5 |
| Pac-12 | 97.5 |
| MAC | 18.5 |
| SoCon | 14.5 |
Now you're probably thinking, "Wow great table, but I sure would like to see those numbers in a pie graph." Well, good news, I have that for you.
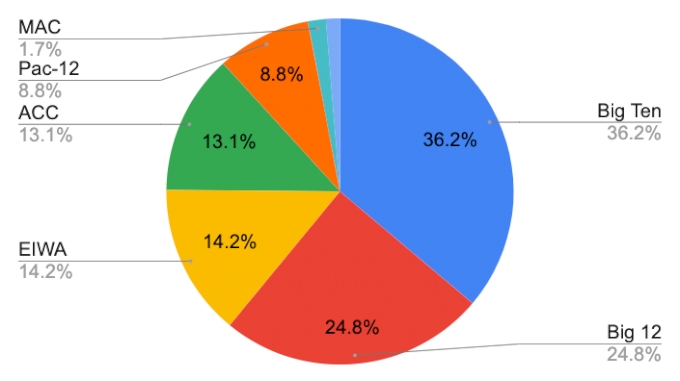
No surprise to see the Big Ten and Big 12 earning the lion's share of NCAA points. EIWA has about three times as many teams as the ACC (though that all changes next year -- more on that shortly) so the similar expected points based on seeds should tell you about the relative strengths of the conferences.
Pac-12 football may be done but the wrestling conference may stick around for another year or two. Despite its moribund status the West Coasters are still expected to score a decent number of points at NCAA for a six-team conference. The MAC and the SoCon, however, are not expected to score many points in Kansas City.
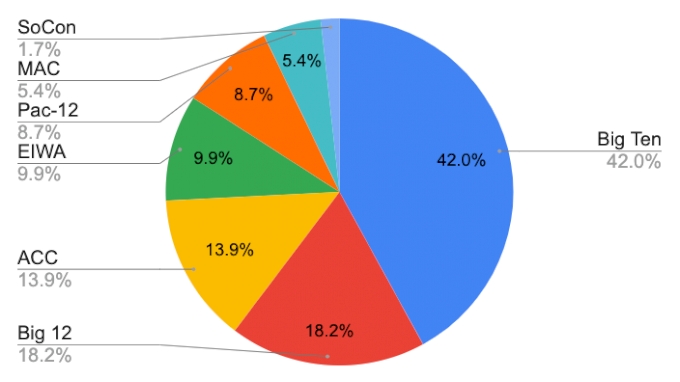
But what about next year, when Stanford moves to the ACC, Arizona State joins the Big 12, and the Ivy League splits off from the EIWA? Rerunning the 2024 numbers with the new conference affiliations produces the following results.
2025
| Conference | Points |
|---|---|
| Big Ten | 401.5 |
| Big 12 | 327.0 |
| ACC | 157.0 |
| EIWA | 80.5 |
| Ivy | 77.0 |
| Pac-12 | 34.0 |
| MAC | 18.5 |
| SoCon | 14.5 |
Above is the table and below is the pie graph.

The Big 12 would be even more competitive with the Big Ten with Arizona State in the conference. The ACC would similarly see a bump with the addition of Stanford.
The EIWA's total would get chopped nearly in half by the Ivy League splintering off, which would project to score more NCAA points than the MAC and SoCon and the reduced Pac-12.
2020-2023
'But how does this year compare to previous years?' you're probably asking. Well good news again for those wondering, I have below a chart of the average number of expected NCAA points per year based on seeds per conference over the years of 2020 to 2023 (remember they didn't wrestle the 2020 NCAAs but they did release fully seeded brackets).
Those were not only the last four years chronologically but also the only other four years with the same number of conferences that currently exist, as the EWL was absorbed by the MAC over the summer of 2019.
That chart is below.
| Conference | Points |
|---|---|
| Big Ten | 467.0 |
| Big 12 | 202.8 |
| ACC | 154.5 |
| EIWA | 110.1 |
| Pac-12 | 97.1 |
| MAC | 60.3 |
| SoCon | 19.3 |
And also the pie chart that you now so desperately crave.
Comparing this season to the average of the last four seasons tells us that the Big 12 and the EIWA are having strong seasons, while the Big Ten and the MAC are slightly down from their recent historical norms.
And now that we've analyzed the expected conference NCAA points by seed we're ready to watch the real thing!