2023 NCAA Championships: By The Numbers
2023 NCAA Championships: By The Numbers
Our annual analytical deep dive into the greatest college wrestling competition of the year.

It's time for our annual analytical deep dive into the greatest collegiate competition of the year, the NCAA D1 Wrestling Championships! We've been doing these blogs for a while now and are thrilled to bring you another new edition of this celebrated series!
Previous NCAAs By The Numbers: 2022 | 2021 | 2020 | 2019 | 2018 | 2017 | 2016 | 2015 | 2014
We've also got heaps more coverage of the 2023 tournament, so check out the following links if you are looking for something you don't see in this blog.
More glorious NCAA Championships coverage: Brackets | Results | Live Blog | Upsets | ReturnIng Points | Team Race | Eligibility Tracker | Toughest Half Bracket | Best Freshmen | Penn State Dominance | Historical Team Results | AAs By HS Class
Now on to the wonderful charts, graphs, maps, tables, chairs, breakfast cereals, and what have you.
We will start with All-Americans by conference. Here are the totals since 2012. I even moved all the teams around, so AAs for Missouri are now all counted for the Big 12, even though Mizzou was in the MAC for most of that time period. Also all the old EWL teams are now in the MAC, etc.
Note that Ivy League teams did not compete in the 2021 season (thanks, stupid covid, my least favorite of all the coronaviruses) so the EIWA numbers are abnormally low that year. Also if you control for the number of teams in each conference, the number of AAs for conferences with less teams, like the ACC and the Pac-12, look more impressive. Just something to keep in mind!
We can also graph those numbers to give them a little more pizzazz, or the last five years (skipping 2021 and 2020, because of stupid covid).
That graph is supposed to be interactive but we'll see if the website can handle it. Otherwise, I'll have to take a screenshot. Anyhow, moving on!
By assigning placement and advancement points to everyone in the NCAA we can get approximate team point values (basically the same amount of team points each wrestler earned minus bonus points, give or take an advancement half point or so) for each conference.
Here's a table of that.
And here's another hopefully interactive graph, this time in pie chart form.
Perhaps a slightly down year for the Big Ten based on past performances, but with the 1st, 2nd and 4th placing team in the tournament, it doesn't appear as if the B1G is in any danger of losing its vice-like grip over the collegiate landscape anytime soon.
Now for the perennial fan favorite, results by home state.
As in the past, we are categorizing wrestlers by state based on what's listed on the student-athlete bio page on their school's website. If you take issue with a wrestler's home state and think it should be something different, take it up with the athlete and their school!
Here's a breakdown of placement by home state.
And here's that table in chart form.
The darker the section of the bar, the higher the placement. A little messy but it's a new chart and I don't have it looking how I'd like it just yet. Maybe it gets tweaked a bit for next year or maybe it just doesn't make the cut. We'll see.
Here's another table of placement by state, but expanded to all placers, including non-All-Americans. I grouped the placements to guys that won one or zero matches not including pigtails (so round of 32/33 & round of 24 for 17 total placers), guys that won two bouts (rounds of 16 and 12 for 8 total placers), guys that finished on the podium outside the top 3 (5 total placers), guys that finished 2nd or 3rd (2 placers), and champs (1 placer, duh). Hopefully that all makes sense when you look at the table.
Or maybe a graph is easier. Here's another attempt at a stacked bar chart.
Not sure if this graph right here is the one but it's decent enough for now. Or not. Either way I made it so I'm not gonna not include it!
What if you wanted to know if your favorite state (or least favorite state, whatever) was having a good year or bad year by historical standards? Then you would want to consult the following table, which compares the number of AAs per state to the most recent 10-year average (not including 2020, because that tournament didn't happen, and 2021, because that tournament was missing the Ivy League schools and the whole year was just plain weird).
Ohioans may not be thrilled to see that they had four less AAs than their historical average but there's a lot of noise in these numbers, so I wouldn't go jumping to any conclusions about what 2023's tourney suggests about the state of wrestling in the state of Ohio. Could very well just be a random blip. Don't hit the panic button yet!
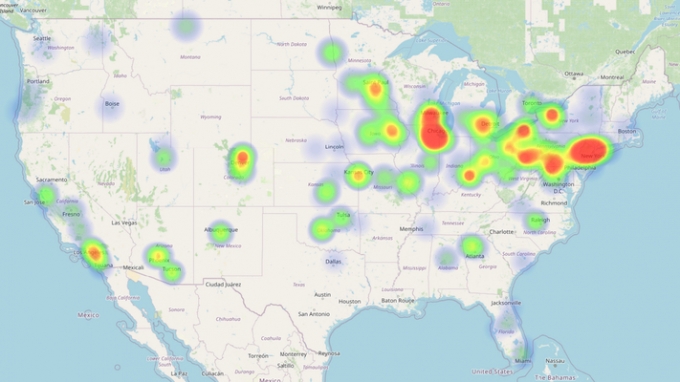
What about a table with the approximate team points (determined in the same method as in the conference numbers above) per state? We have a table for that as well. And here it is!
This one would definitely be easier to read in a heat map, so I've created one for you.
Our first, but not last, heat map of the blog.
"Pennsylvania rules!" you may be saying to yourself right now. And yes, the Keystone state produces wrestlers at an unparalleled clip. But on a per capita basis, they have not just rivals, but superiors.
Of course, there are more ways to massage these numbers. I've been told that both the 'raw numbers' and the per capita figures are simultaneously meaningless and the only true measure worth taking by different people (you can guess which state they are from by their arguments!). So your mileage may vary with either. I am just here to provide the information. What you do with it and how you use it (or ignore it) when you are arguing about wrestling with your friends (or enemies) online or in real life is up to you. I make no judgments!
Anyway, a good rule of thumb is one AA for every two million inhabitants is a very good number. One or more AA for every million and you are in elite company.
Moving on to how the team performed, I added up the advancement and placement points (same method as before) to see how each team was predicted to do based on seeds and their Flo rankings, and compared to actual placements. That table is below.
I added up the absolute value of all the differences and those numbers suggest that Flo's rankings were slightly more accurate in predicting the actual results than the seeds, but it was only by around 13% so we're not going to engrave ourselves a plaque or anything.
Now our website is just about at capacity with all these graphs and charts and is taking a long time to save and is making me nervous that it's going to crash and ruin all my hard work so I'm going to try and embed one last heat map of NCAA points based hometown and call it quits for now.
More to come!
Related Content
 Why Penn State Wrestling Fans NEED To Watch The US Open
Apr 25, 2024
 J'den Cox | The Bader Show (Ep. 412)
Apr 25, 2024
 Two-Time All-American Wyatt Hendrickson Enters Transfer Portal
Apr 24, 2024
 Ohio State Coach Tom Ryan Hospitalized After Car Wreck
Apr 23, 2024
 Ben Bennett Hired As Head Wrestling Coach Of Central Michigan University
Apr 23, 2024
 Donnie Vinson Named New Buffalo Head Coach
Apr 23, 2024
 2024 NCAA Wrestling D1 Commitment List
Apr 22, 2024
 Helen Maroulis Makes 3rd Straight Olympic Wrestling Team
Apr 21, 2024
 Aaron Brooks Had To Take His Focus Off Of The Underhook To Beat David Taylor
Apr 21, 2024