Mapping Flo's High School Rankings
Mapping Flo's High School Rankings
We've taken a deep dive into FloWrestling's latest High School rankings by the numbers, now we can plug all those numbers into our mapping software and see what the current landscape of wrestling recruits looks like.
We've taken a deep dive into FloWrestling's latest high school rankings by the numbers. Now we can plug all those numbers into our mapping software and get a comprehensive look at the current landscape of wrestling recruits.
Dropping a pin down for every high school from the rankings gives us the following map.
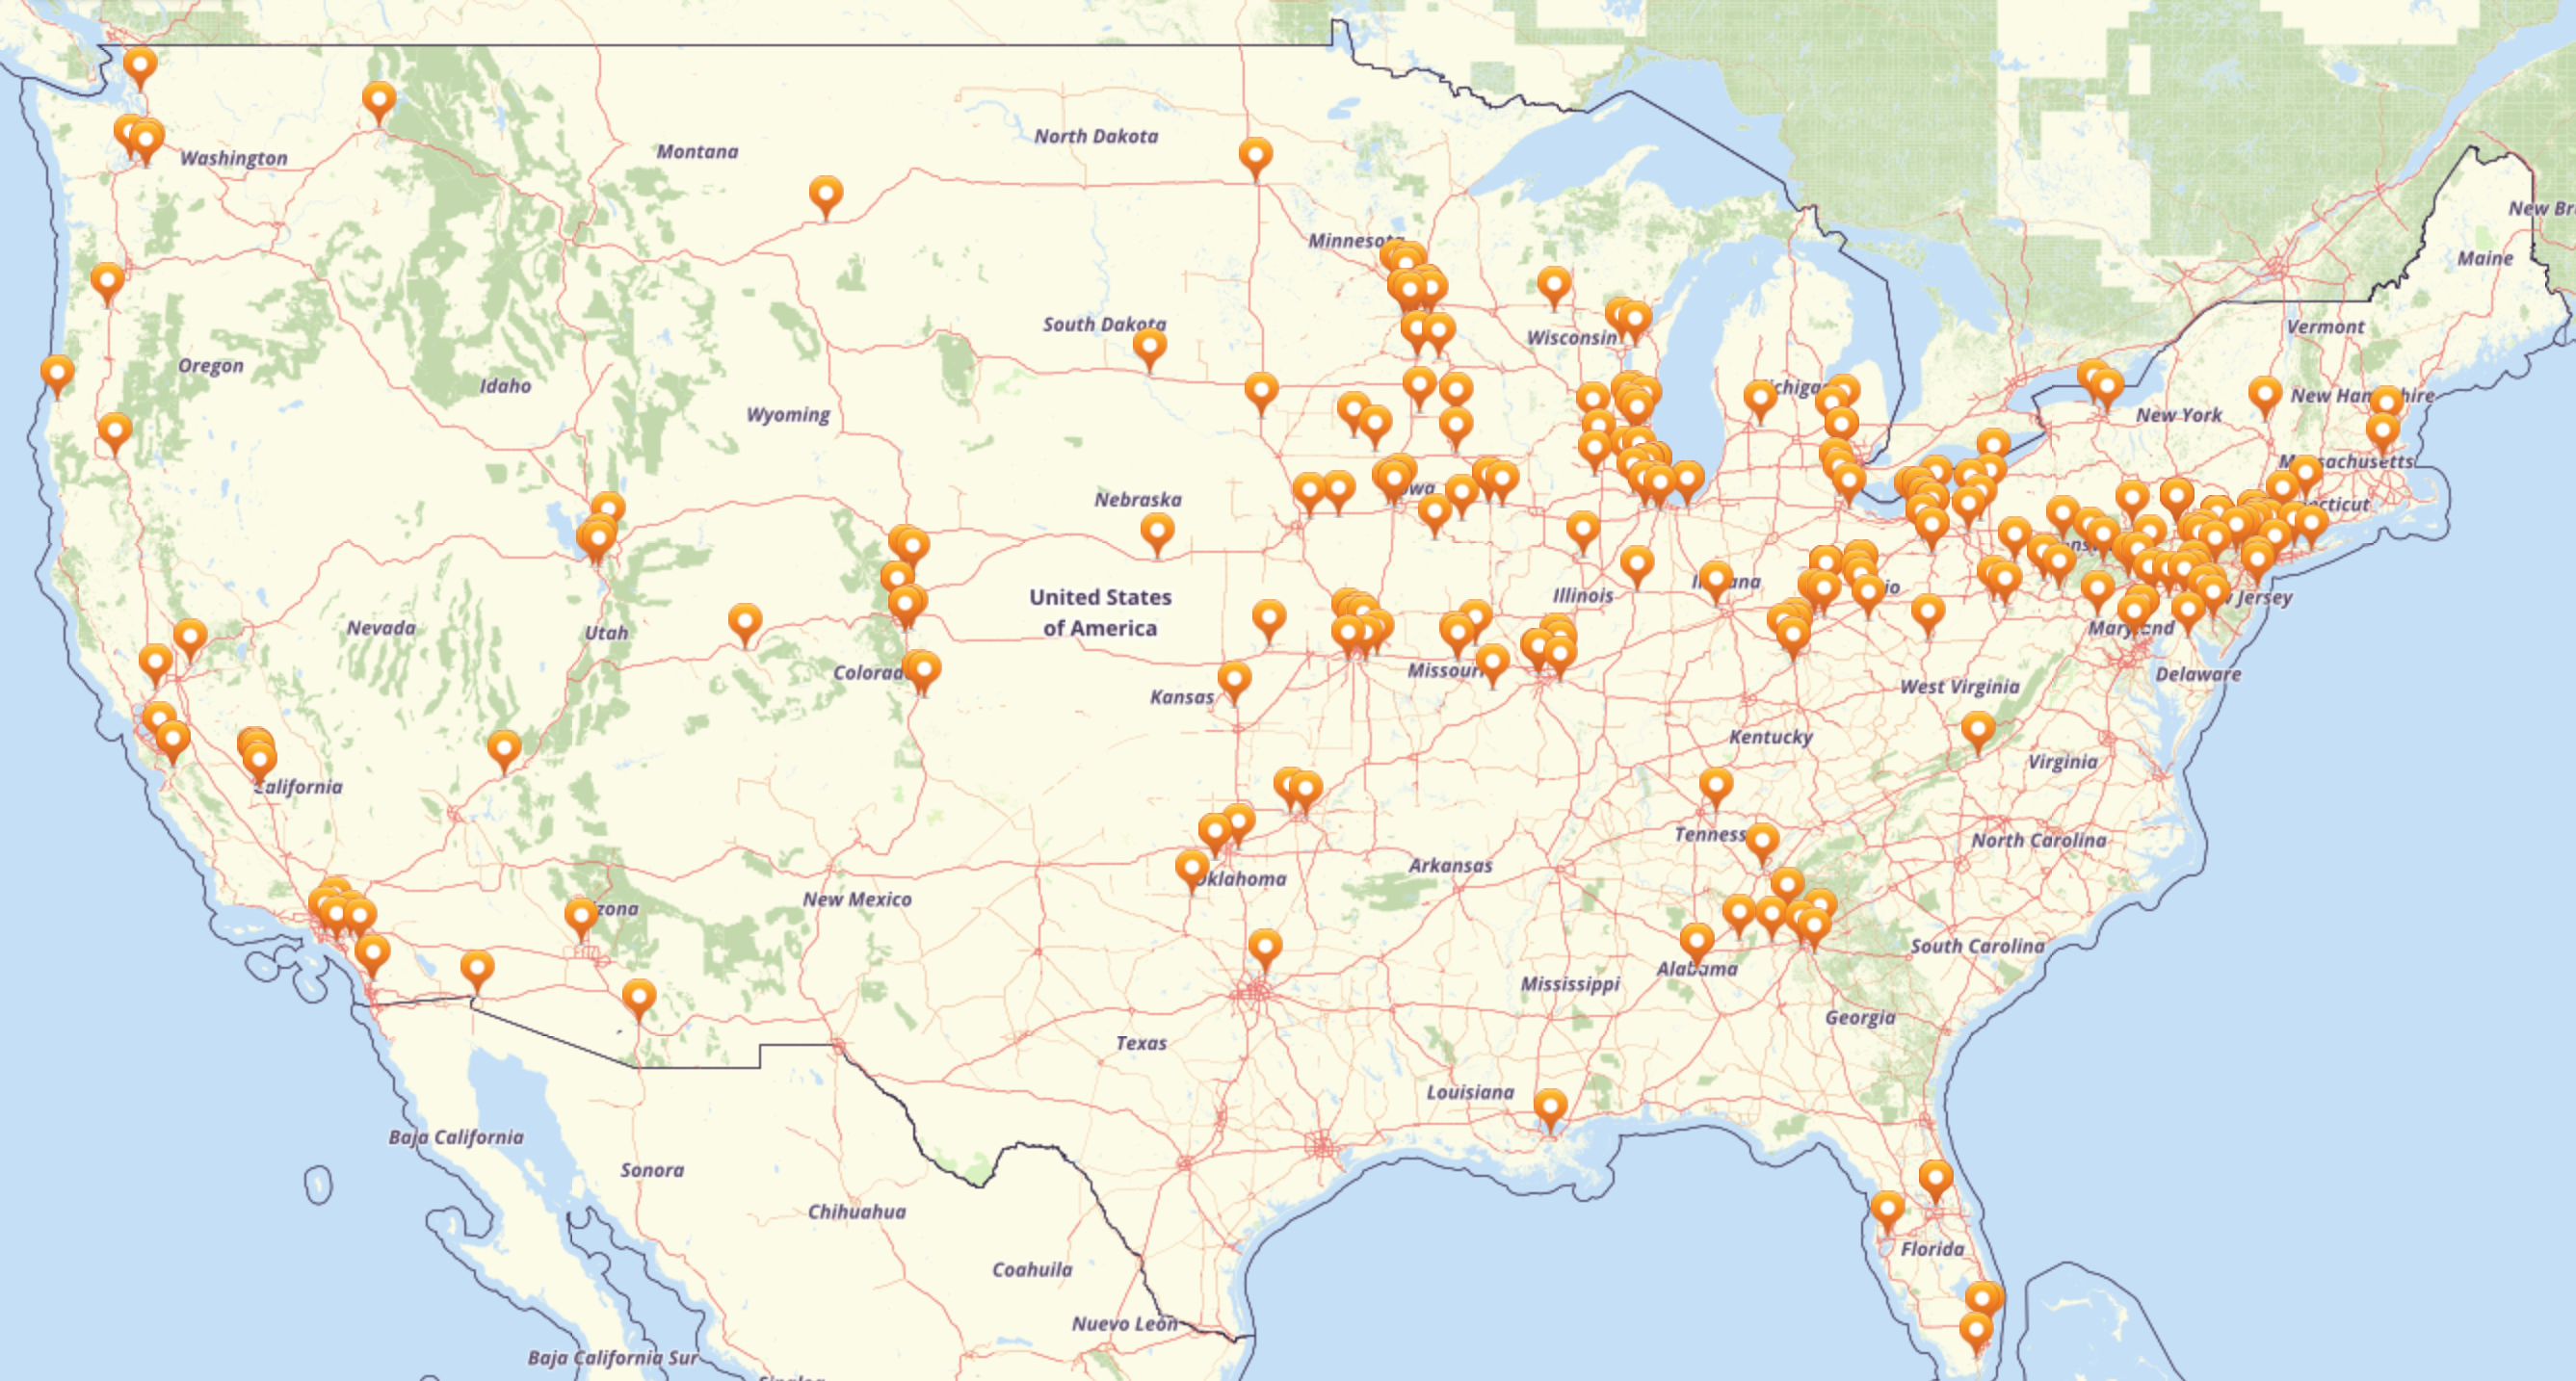
As anyone who looked at the list of ranked wrestlers by state could have predicted, there is a preponderance of pins in the Northeast and Midwestern states. New Jersey, Pennsylvania, and Ohio are covered in orange. The Chicago metro area is also heavily populated with young hammers.
We can get a better picture of which metro areas by utilizing the "clustering" function.
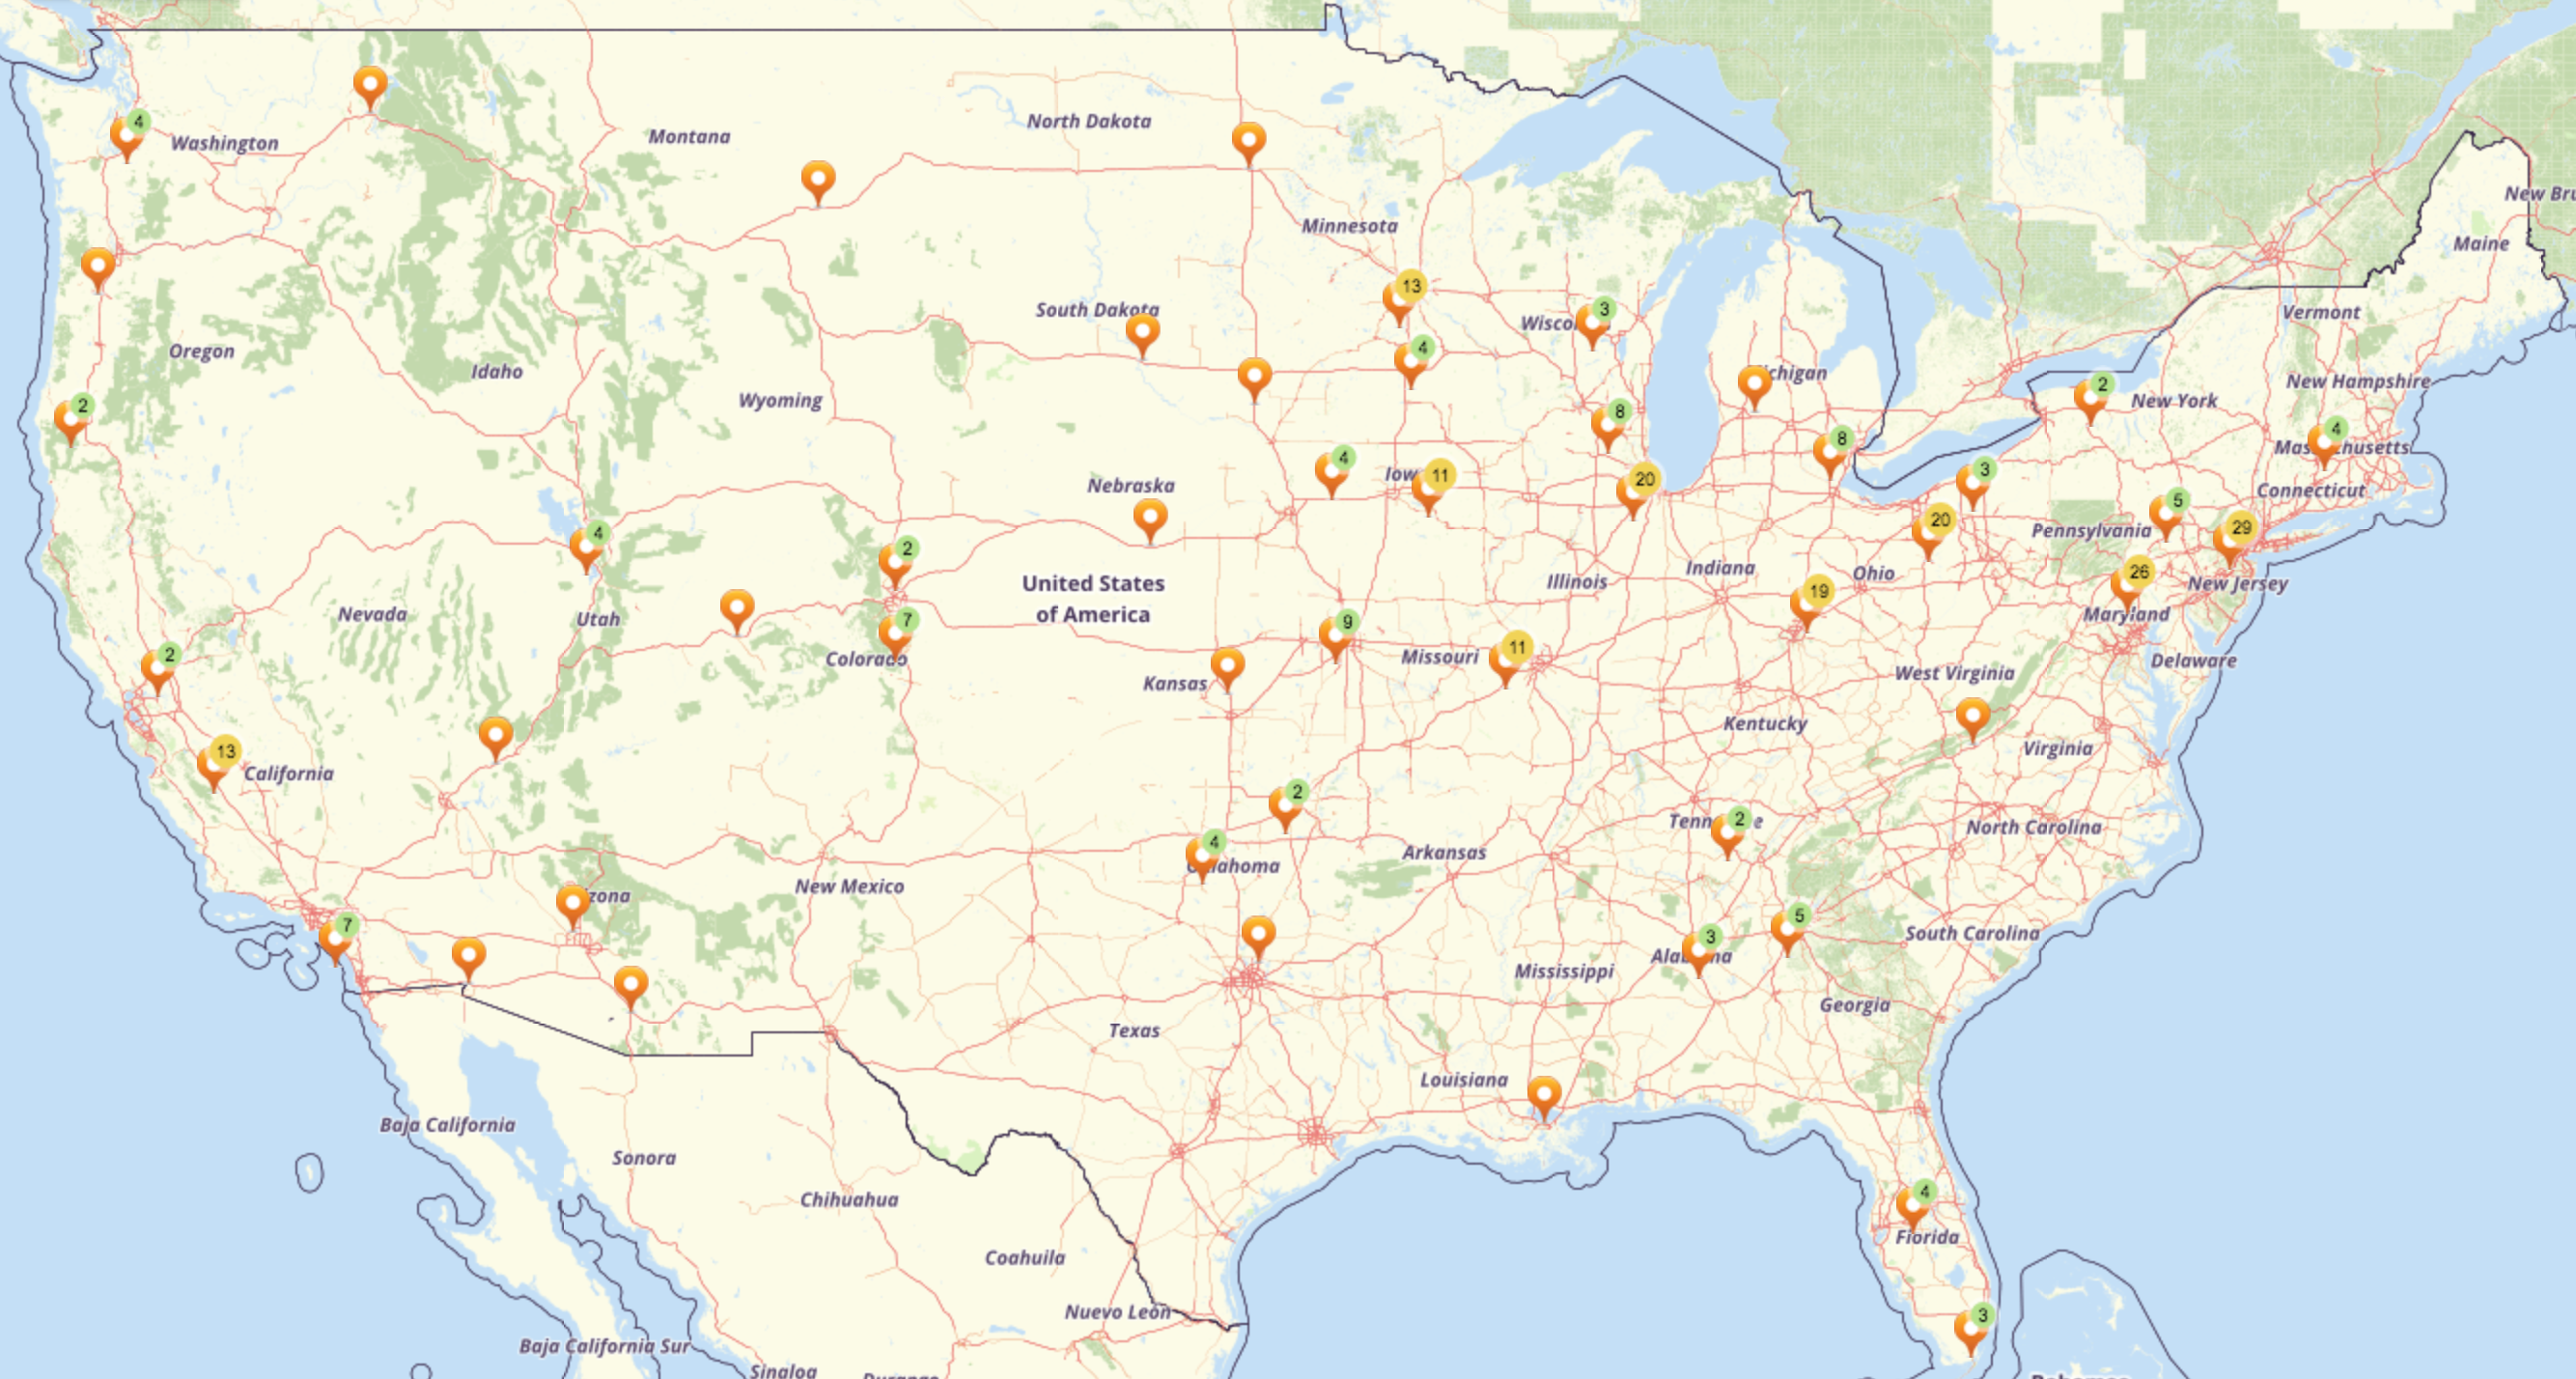
The clusters are not perfect, as the computer algorithm decides where the boundaries, but it does give you a rough approximation of where the geographic recruiting hot spots are located. And it tells you exactly how many wrestlers go to high schools in that area.
For instance, from the map we can see that South Florida and Central Florida have three and four prospects, respectively. Additionally, a concentration of clusters can be found around Atlanta, with 10 total ranked wrestlers in the Southern Appalachian area, a positive sign for a growing region of the sport.
The state of Missouri is similarly sporting a bumper crop of recruits, with St. Louis and Kansas City splitting 20 wrestlers between them. Out on the West Coast, NorCal has SoCal beat 15-7 in the recruiting battle. And in the Rockies, Denver appears to be the leader in wrestler-producing cities.
Meanwhile, in the fight for the title of most fertile wrestling recruiting ground, any conclusion has to come with a few caveats. Cleveland would likely win for most recruits per capita, whereas either Chicago or New York City have the highest raw numbers. The ultimate winner would depend on where you draw your metro area boundaries, an exercise with an unavoidably subjective component. As such, I'm comfortable eyeballing the map and calling it a draw. Your opinion may vary.
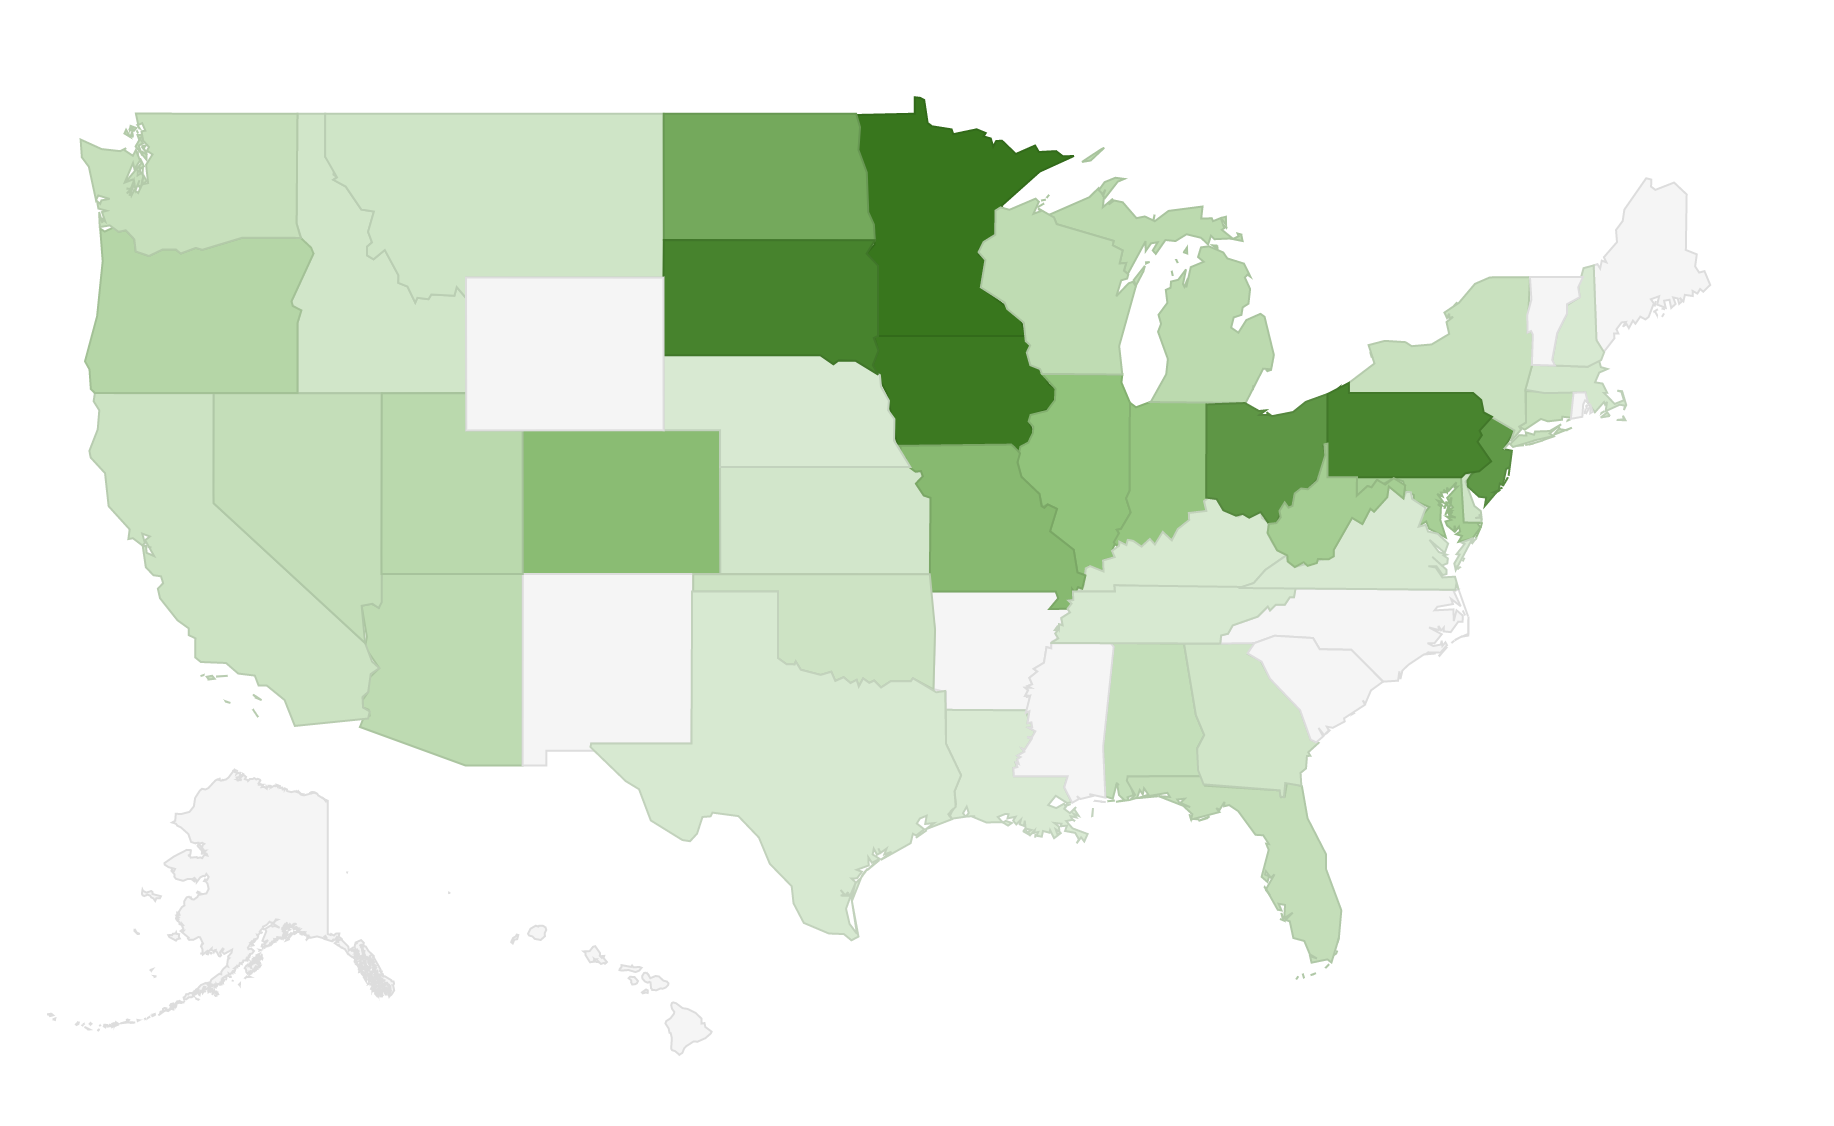
Finally, we can create a heat map of U.S. states using our NCAA placement points (20, 16, 13.5, 12.5, 10, 9, 6.5, 5.5, 2, 2, 2, 2, 1.5, 1.5, 1.5, 1.5, 0.5, 0.5, 0.5, 0.5) for those ranked No. 1 through No. 20. That map is below.
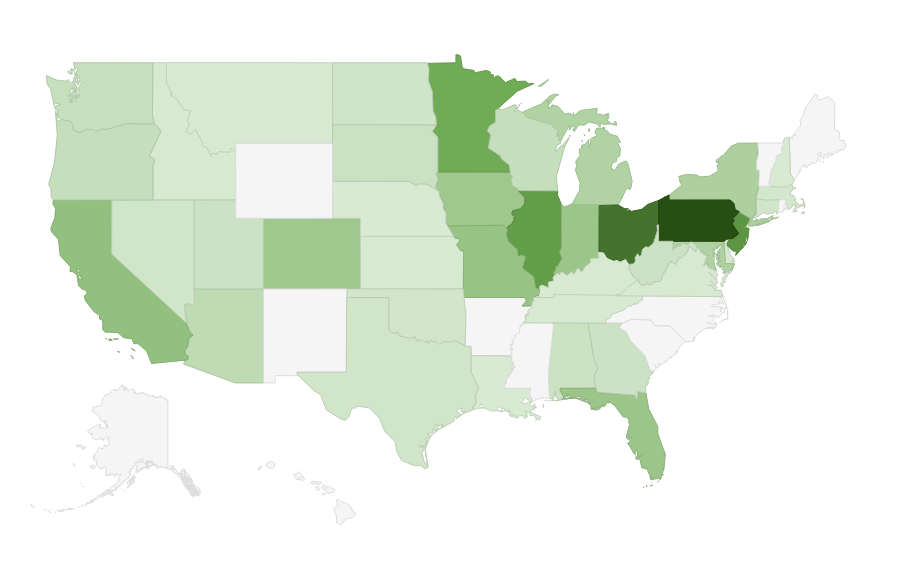
Again, no surprises, with Pennsylvania, New Jersey, and Ohio leading the way and Illinois and Minnesota not far behind. This may be common knowledge to wrestling fans, but it's always good to back up these beliefs with facts.
And one final measurement that we left out of our last analysis is to take those same NCAA points by state and adjust them for population. That table, which calculates hypothetical NCAA points per million inhabitants, produces a list in a similarly but slight different order and can be found below.
And finally, our heat map using the same calculation is below.
Dropping a pin down for every high school from the rankings gives us the following map.

As anyone who looked at the list of ranked wrestlers by state could have predicted, there is a preponderance of pins in the Northeast and Midwestern states. New Jersey, Pennsylvania, and Ohio are covered in orange. The Chicago metro area is also heavily populated with young hammers.
We can get a better picture of which metro areas by utilizing the "clustering" function.

The clusters are not perfect, as the computer algorithm decides where the boundaries, but it does give you a rough approximation of where the geographic recruiting hot spots are located. And it tells you exactly how many wrestlers go to high schools in that area.
For instance, from the map we can see that South Florida and Central Florida have three and four prospects, respectively. Additionally, a concentration of clusters can be found around Atlanta, with 10 total ranked wrestlers in the Southern Appalachian area, a positive sign for a growing region of the sport.
The state of Missouri is similarly sporting a bumper crop of recruits, with St. Louis and Kansas City splitting 20 wrestlers between them. Out on the West Coast, NorCal has SoCal beat 15-7 in the recruiting battle. And in the Rockies, Denver appears to be the leader in wrestler-producing cities.
Meanwhile, in the fight for the title of most fertile wrestling recruiting ground, any conclusion has to come with a few caveats. Cleveland would likely win for most recruits per capita, whereas either Chicago or New York City have the highest raw numbers. The ultimate winner would depend on where you draw your metro area boundaries, an exercise with an unavoidably subjective component. As such, I'm comfortable eyeballing the map and calling it a draw. Your opinion may vary.
Finally, we can create a heat map of U.S. states using our NCAA placement points (20, 16, 13.5, 12.5, 10, 9, 6.5, 5.5, 2, 2, 2, 2, 1.5, 1.5, 1.5, 1.5, 0.5, 0.5, 0.5, 0.5) for those ranked No. 1 through No. 20. That map is below.

Again, no surprises, with Pennsylvania, New Jersey, and Ohio leading the way and Illinois and Minnesota not far behind. This may be common knowledge to wrestling fans, but it's always good to back up these beliefs with facts.
And one final measurement that we left out of our last analysis is to take those same NCAA points by state and adjust them for population. That table, which calculates hypothetical NCAA points per million inhabitants, produces a list in a similarly but slight different order and can be found below.
| State | NCAA Pts | Pts/Million |
|---|---|---|
| MN | 108 | 19.57 |
| IA | 60 | 19.14 |
| SD | 15.5 | 17.91 |
| PA | 228 | 17.83 |
| OH | 181 | 15.54 |
| NJ | 136.5 | 15.26 |
| ND | 10 | 13.19 |
| MO | 68 | 11.16 |
| CO | 60 | 10.83 |
| IL | 128 | 10.00 |
| IN | 63.5 | 9.57 |
| WV | 13.5 | 7.37 |
| MD | 42.5 | 7.06 |
| OR | 21 | 5.13 |
| UT | 13.5 | 4.42 |
| MI | 41 | 4.13 |
| AZ | 27 | 3.90 |
| WI | 21.5 | 3.72 |
| FL | 63.5 | 3.08 |
| NV | 9 | 3.06 |
| AL | 14.5 | 2.98 |
| WA | 19.5 | 2.68 |
| CT | 9.5 | 2.66 |
| NY | 46 | 2.33 |
| CA | 73.5 | 1.87 |
| OK | 7 | 1.78 |
| DE | 1.5 | 1.58 |
| MT | 1.5 | 1.44 |
| GA | 13.5 | 1.31 |
| ID | 2 | 1.19 |
| KS | 3 | 1.03 |
| MA | 6.5 | 0.95 |
| KY | 2 | 0.45 |
| TN | 2.5 | 0.38 |
| NH | 0.5 | 0.37 |
| TX | 9 | 0.32 |
| NE | 0.5 | 0.26 |
| VA | 2 | 0.24 |
| LA | 0.5 | 0.11 |
And finally, our heat map using the same calculation is below.

Get all of the hottest FloWrestling content!
Sign up for the FloWrestling newsletter for instant access to: breaking news, live events, results, rankings, archived matches and more!Related Content
 Last Week In Recruiting: April 8-14
Apr 16, 2024
 2024 NCAA Wrestling D1 Commitment List
Apr 15, 2024
 2025 NCAA Wrestling D1 Commitment List
Apr 15, 2024
 Replay: Mat 13 - 2024 Adidas Nationals | Apr 14 @ 8 AM
Apr 15, 2024
 Replay: Mat 6 - 2024 Adidas Nationals | Apr 14 @ 8 AM
Apr 15, 2024
 Replay: Mat 7 - 2024 Adidas Nationals | Apr 14 @ 8 AM
Apr 15, 2024
 Replay: Mat 5 - 2024 Adidas Nationals | Apr 14 @ 8 AM
Apr 15, 2024
 Replay: Mat 10 - 2024 Adidas Nationals | Apr 14 @ 8 AM
Apr 15, 2024
 Replay: Mat 4 - 2024 Adidas Nationals | Apr 14 @ 8 AM
Apr 15, 2024