You Do The Math: High School Participation Numbers
You Do The Math: High School Participation Numbers
High school wrestling participation numbers are up across the country, but not every state is seeing increases. We take a look at which states are adding wrestlers and which ones are seeing declines in participation numbers.

High school wrestling participation numbers are down across the country, but not every state is seeing declines. In recent years, several states are bucking the trend and seeing explosive growth in high school wrestling.
We took a look at the last ten years of data provided by the National Federation of State High School Associations to see where wrestling is seeing growth, and where it is losing participants.
The graph below charts the number of high school wrestlers reported by each state, first in 2007 and then in 2016.
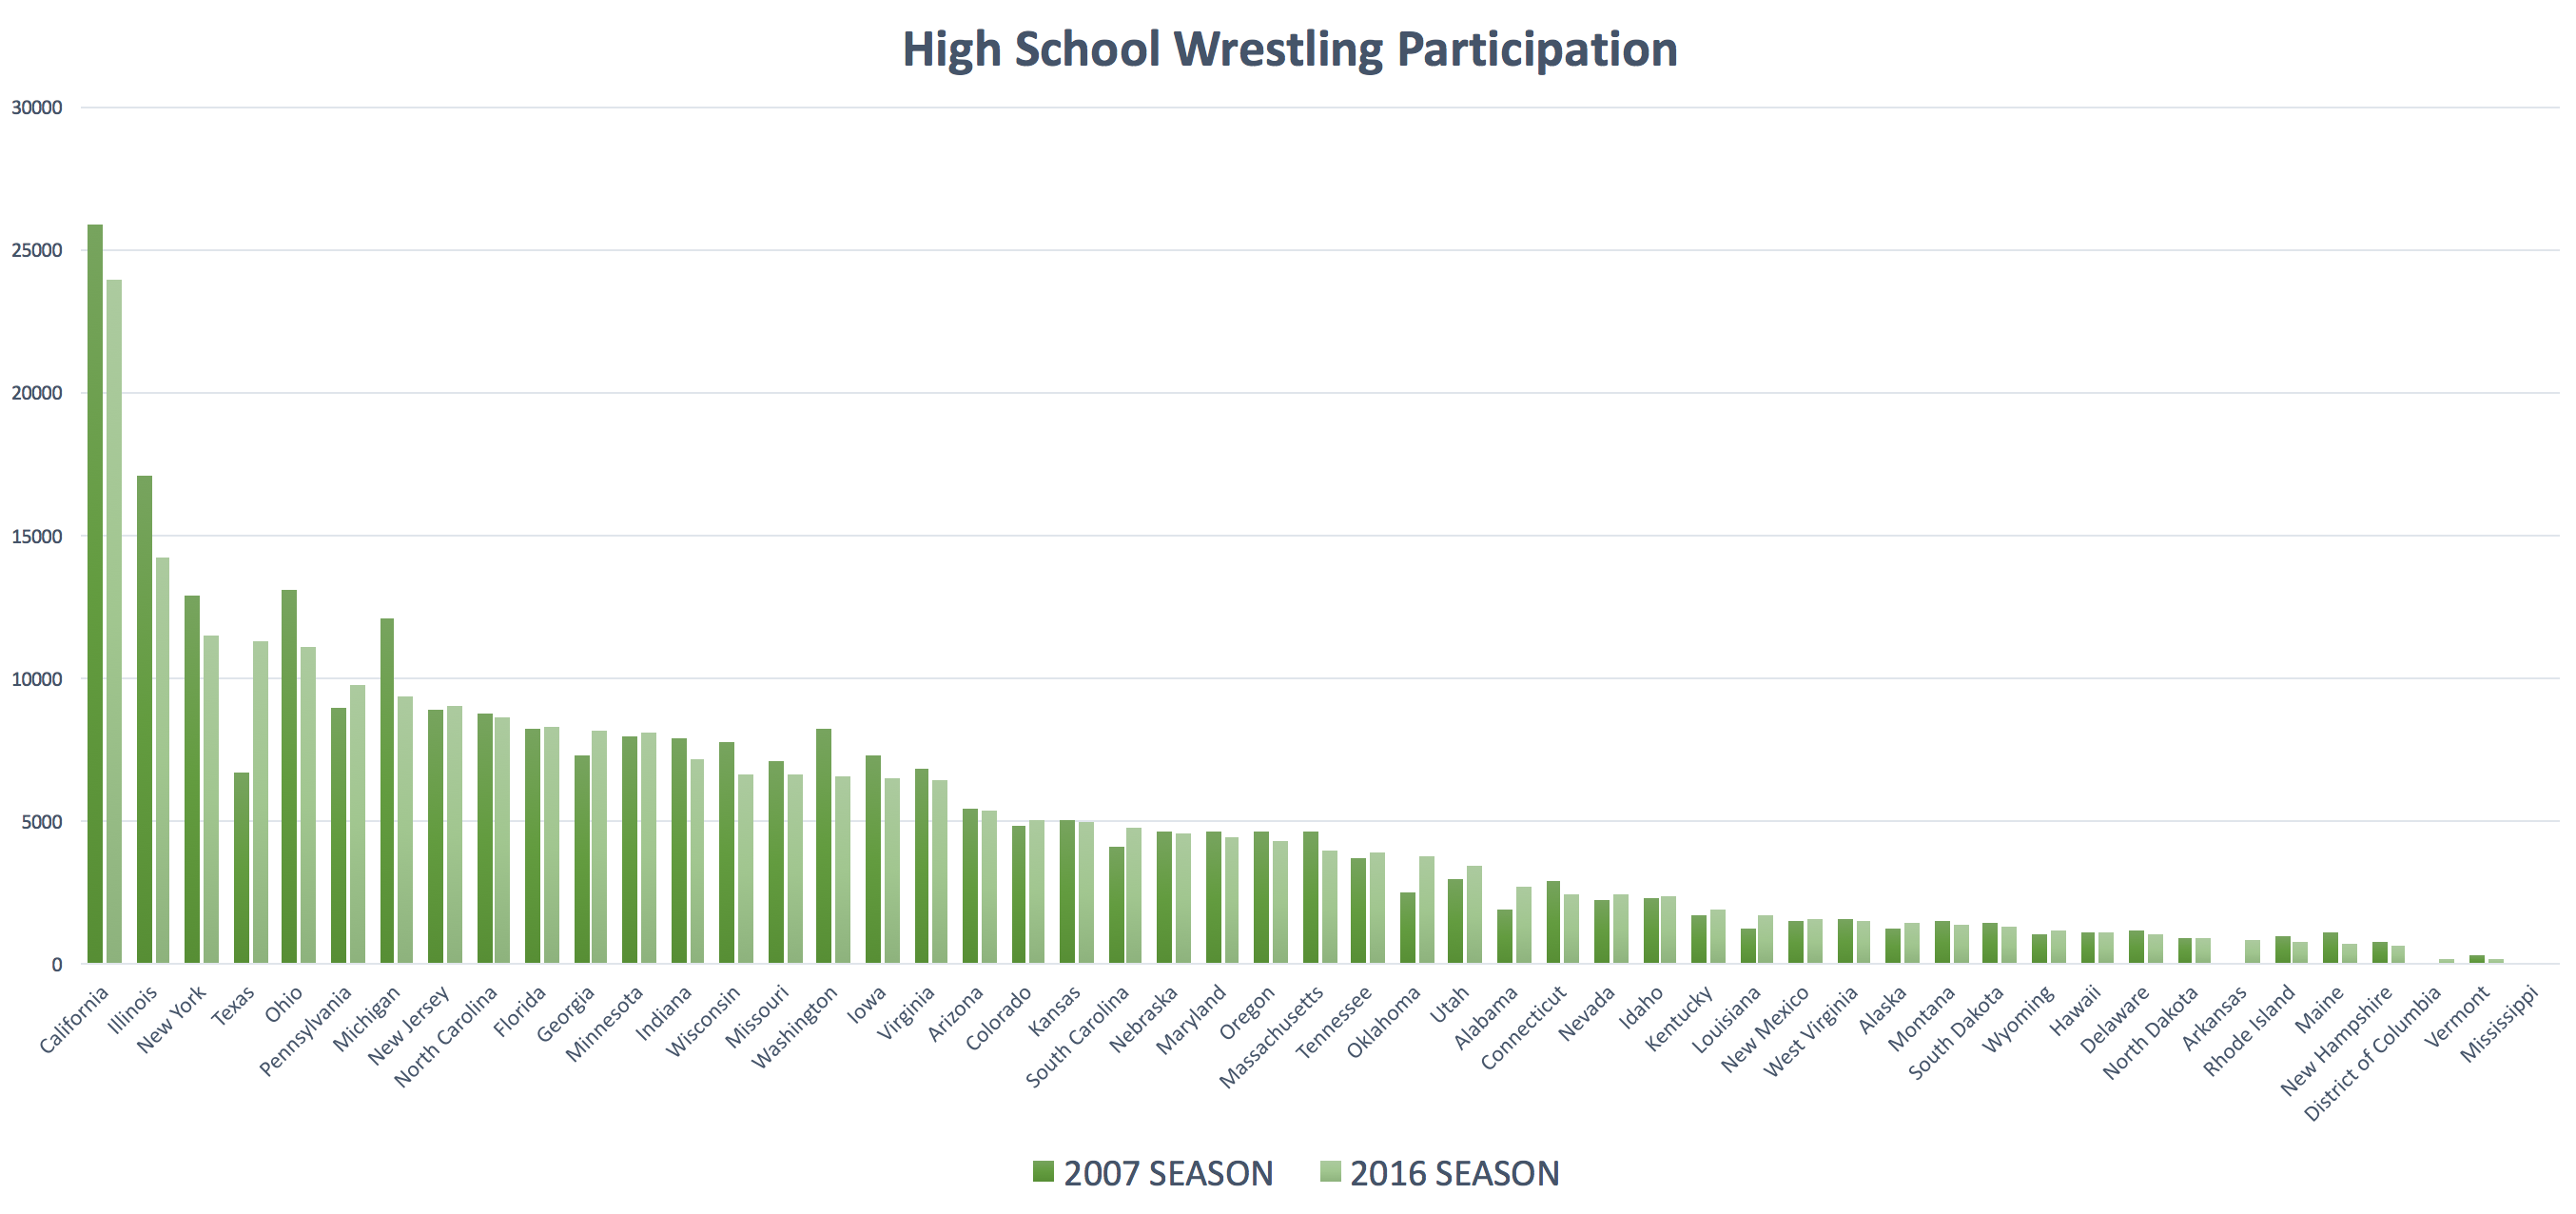
Total participants are down 6,593 in the last ten years for which we have data. There were 257,246 high school wrestlers reported for the 2006-2007 season. By the 2015-2016 season there were 250,653.
Illinois saw the biggest drop in numbers, at 2,849 fewer wrestlers from 2007 to 2016. Michigan had second largest drop at 2,689. Ohio, California, Washington, New York and Wisconsin also all saw their high school wrestling numbers fall by over 1,000.
Balancing those drops were huge gains made in Texas and Oklahoma. Texas added a staggering 4,653 new wrestlers over the last ten years. Oklahoma added 1,285. Both southwestern states saw gains of over 5% a year.
Also of note is Arkansas, which gained 839 wrestlers. While that is by far not the highest total, it is coming from a previous count of zero. In 2007, Arkansas was the only state to not report any wrestlers. Now all fifty states (and the District of Columbia) are represented. Even Mississippi reported 25 wrestlers in 2016, despite the state not officially sponsoring the sport.
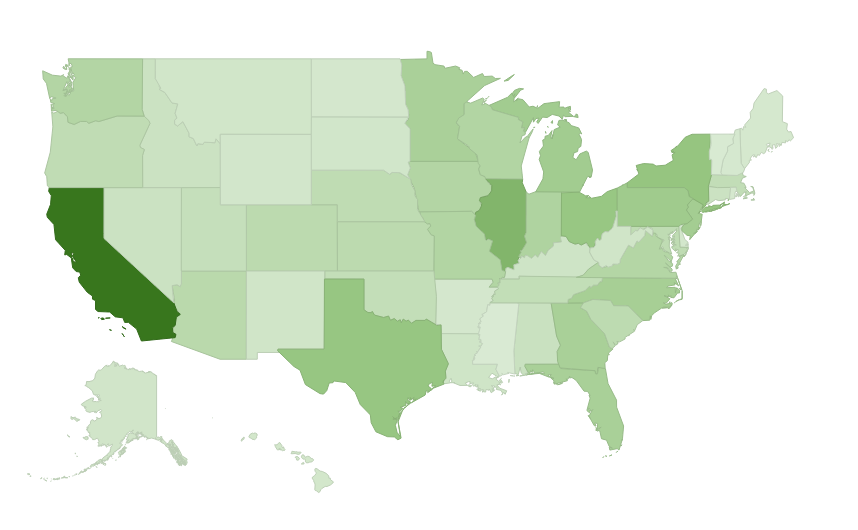
California leads the way in total high school wrestlers, with 23,945. Illinois comes in second with 14,223 reported wrestlers in 2016.
A heat map of total participants by state can be found below.
We won't try to speculate what might be causing the various states to see their participation numbers either rise and fall, at least not yet anyway. And we will also set aside further analysis of the numbers, for now.
In the meantime, you can check out the raw numbers in the table below and make your own guesses on the hows and whys in the comments.
We took a look at the last ten years of data provided by the National Federation of State High School Associations to see where wrestling is seeing growth, and where it is losing participants.
The graph below charts the number of high school wrestlers reported by each state, first in 2007 and then in 2016.

Total participants are down 6,593 in the last ten years for which we have data. There were 257,246 high school wrestlers reported for the 2006-2007 season. By the 2015-2016 season there were 250,653.
Illinois saw the biggest drop in numbers, at 2,849 fewer wrestlers from 2007 to 2016. Michigan had second largest drop at 2,689. Ohio, California, Washington, New York and Wisconsin also all saw their high school wrestling numbers fall by over 1,000.
Balancing those drops were huge gains made in Texas and Oklahoma. Texas added a staggering 4,653 new wrestlers over the last ten years. Oklahoma added 1,285. Both southwestern states saw gains of over 5% a year.
Also of note is Arkansas, which gained 839 wrestlers. While that is by far not the highest total, it is coming from a previous count of zero. In 2007, Arkansas was the only state to not report any wrestlers. Now all fifty states (and the District of Columbia) are represented. Even Mississippi reported 25 wrestlers in 2016, despite the state not officially sponsoring the sport.
California leads the way in total high school wrestlers, with 23,945. Illinois comes in second with 14,223 reported wrestlers in 2016.
A heat map of total participants by state can be found below.

We won't try to speculate what might be causing the various states to see their participation numbers either rise and fall, at least not yet anyway. And we will also set aside further analysis of the numbers, for now.
In the meantime, you can check out the raw numbers in the table below and make your own guesses on the hows and whys in the comments.
| STATE | 2007 SEASON | 2016 SEASON |
|---|---|---|
| California | 25896 | 23945 |
| Illinois | 17072 | 14223 |
| New York | 12879 | 11521 |
| Texas | 6674 | 11327 |
| Ohio | 13098 | 11114 |
| Pennsylvania | 8946 | 9780 |
| Michigan | 12085 | 9396 |
| New Jersey | 8933 | 9070 |
| North Carolina | 8744 | 8645 |
| Florida | 8269 | 8297 |
| Georgia | 7275 | 8171 |
| Minnesota | 7957 | 8135 |
| Indiana | 7904 | 7156 |
| Wisconsin | 7781 | 6667 |
| Missouri | 7082 | 6636 |
| Washington | 8258 | 6570 |
| Iowa | 7313 | 6512 |
| Virginia | 6867 | 6415 |
| Arizona | 5474 | 5400 |
| Colorado | 4828 | 5052 |
| Kansas | 5020 | 5008 |
| South Carolina | 4114 | 4763 |
| Nebraska | 4655 | 4543 |
| Maryland | 4633 | 4469 |
| Oregon | 4659 | 4320 |
| Massachusetts | 4615 | 3986 |
| Tennessee | 3739 | 3904 |
| Oklahoma | 2500 | 3785 |
| Utah | 2995 | 3421 |
| Alabama | 1940 | 2719 |
| Connecticut | 2902 | 2439 |
| Nevada | 2240 | 2420 |
| Idaho | 2325 | 2392 |
| Kentucky | 1680 | 1880 |
| Louisiana | 1224 | 1725 |
| New Mexico | 1488 | 1608 |
| West Virginia | 1573 | 1500 |
| Alaska | 1216 | 1469 |
| Montana | 1529 | 1382 |
| South Dakota | 1423 | 1333 |
| Wyoming | 1078 | 1153 |
| Hawaii | 1135 | 1107 |
| Delaware | 1148 | 1039 |
| North Dakota | 933 | 903 |
| Arkansas | 0 | 839 |
| Rhode Island | 955 | 781 |
| Maine | 1136 | 701 |
| New Hampshire | 747 | 641 |
| District of Columbia | 0 | 205 |
| Vermont | 290 | 161 |
| Mississippi | 19 | 25 |
Related Content
 60 lbs Round Of 16 - Weston Myers, Pawhuska Elks Takedown vs Rylan Rathgeber, East Kansas Eagles
Apr 18, 2024
 Fargo & Ironman Champ Vince Bouzakis Commits To Ohio State Wrestling
Apr 17, 2024
 2023-2024 Women's College Commitment List
Apr 17, 2024
 Last Week In Recruiting: April 8-14
Apr 16, 2024
 2024 NCAA Wrestling D1 Commitment List
Apr 15, 2024
 2025 NCAA Wrestling D1 Commitment List
Apr 15, 2024
 Replay: Mat 13 - 2024 Adidas Nationals | Apr 14 @ 8 AM
Apr 15, 2024
 Replay: Mat 6 - 2024 Adidas Nationals | Apr 14 @ 8 AM
Apr 15, 2024
 Replay: Mat 7 - 2024 Adidas Nationals | Apr 14 @ 8 AM
Apr 15, 2024