YOU DO THE MATH: Is NCAA Wrestling in a Slump?
YOU DO THE MATH: Is NCAA Wrestling in a Slump?
ncaa D1 wrestling analysis history statistics 2017 2010
It's been postulated by various industry experts that we are in the midst of an NCAA D1 wrestling slump. But is this true? Let's take another deep dive into the historical data to find out.
COMPARING THE PRESENT WITH THE PAST
It stands to reason that not all wrestling classes are created equal. Some will naturally have more talent then others. While any current perceived slump may just be a mirage conjured by wistful remembrances of competitions past, we can analyze how well each year's graduating class fared at the NCAA Tournament to see how they compared with the talent from other classes.
The "kids these days don't know how tough things used to be" theory will likely persist regardless of our analysis, however, if there is variation in the results (and expect to see some variation), then we can reasonably conclude that some years were tougher than others. By comparing the results, we can then decide if we are on the upward upward or downward slope of a talent cycle
GREAT, LETS SEE THAT DATA
First, it would help to preface exactly what kind of data at which we shall shortly be looking.
I took the results from the last 17 NCAA tournaments (2000-2016, because that is the data I have at my disposal) and sorted it by total number of National Qualifiers per year of eligibility. It should be noted that no distinction was made for wrestlers that had redshirts available. The results were as follows:
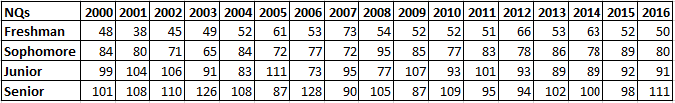
We can now add up each class's total number of National Qualifiers over a four year period. The data is not perfect, as not everyone wrestles four consecutive years, and, as previously noted, redshirts are not taken into account, however, for our purposes, it will be plenty good enough. Those numbers are as follows:

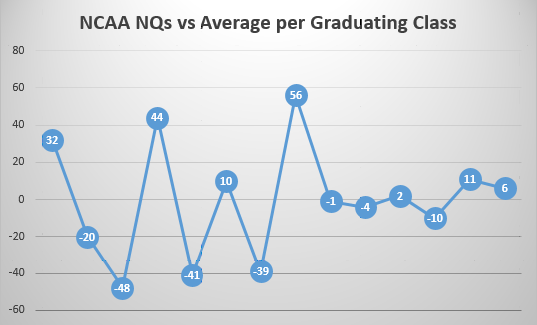
And now, because we're all about good visuals, we can take the average number of NQ's per class, 328, and graph the difference in NQs per class year by year.
NOT BAD. NOW CAN YOU DO THAT FOR ALL AMERICANS?
Sure, coming right up.
Total All Americans by year of eligibility:
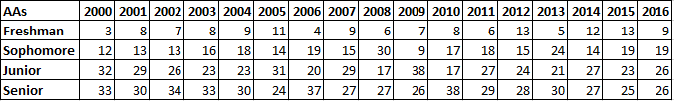
Total All Americans per class:

Year by year graph of All Americans per class minus the average (78):
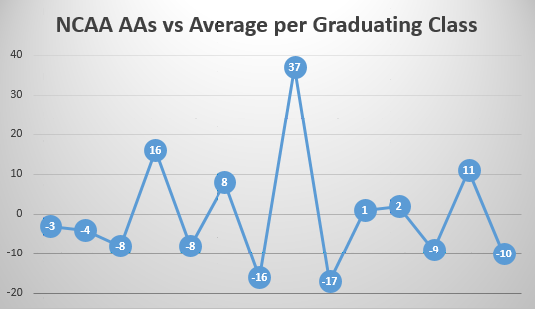
WONDERFUL, SO WHAT DOES THIS ALL MEAN?
In what would normally be referred to as the "conclusions" portion of an analysis, I would say that we can safely conclude that the graduating class of 2010 was pretty bad ass.
The 2010ers out preformed their peers by a considerable margin in qualifiers, and by an extreme margin in podium spots. In stat speak, they were over 1.8 standard deviations above the norm in NQs, and over 2.5 standard deviations above the norm in AAs.
In other words, those dudes wrestle good.
Here's a list of 4 and 3 time All Americans from that class, so that we might bask in the reflected glory of their accomplishments (list courtesy of D1CW):
Jake Varner (Iowa State) 2nd, 2nd, 1st, 1st
Brent Metcalf (Iowa) 1st, 2nd, 1st
Troy Nickerson (Cornell) 2nd, 3rd, 1st, 4th
Jayson Ness (Minnesota) 5th, 2nd, 3rd, 1st
Mike Pucillo (Ohio State) 6th, 1st, 2nd
Franklin Gomez (Michigan State) 3rd, 1st, 3rd
Angel Escobedo (Indiana) 4th, 1st, 5th, 3rd
Dustin Schlatter (Minnesota) 1st, 3rd, 7th
JP O'Connor (Harvard) 5th, 6th, 1st
David Zabriskie (Iowa State) 6th, 5th, 1st
Max Askren (Missouri) 7th, 5th, 1st
Craig Brester (Nebraska) 4th, 2nd, 2nd
Jared Rosholt (Oklahoma State) 4th, 3rd, 2nd
Lance Palmer (Ohio State) 4th, 8th, 4th, 2nd
Hudson Taylor (Maryland) 3rd, 3rd, 4th
Mike Cannon (American) 6th, 8th, 3rd
Phil Keddy (Iowa) 6th, 4th, 8th
WAIT, I THOUGHT WE WERE TALKING ABOUT 2017?
Good point. The 2010 thing just caught me by surprise.
We'd have to wait until after the season concludes to get a complete picture of this year's graduating class, but we can still see how they performed in the three most recent tournaments.
First, the average number of NQs and AAs for Freshmen, Sophomores and Juniors, since 2000:
NQs
Freshman: 54
Sophomore: 80
Junior: 94
AAs
Freshman: 8
Sophomore: 17
Junior: 25
Now, the accolades of our current crop of seniors in their first three years of eligibility (with the difference versus the average in parentheses):
NQs
Freshman: 63 (+9)
Sophomore: 89 (+9)
Junior: 91 (-3)
AAs
Freshman: 12 (+4)
Sophomore: 19 (+2)
Junior: 26 (+1)
As you can see, the Class of 2017 is right on track, if not slightly above average. So rather than slumping, my guess is that we are in an extended hangover from the insane class of 2010, and any class is going to suffer by comparison.
It is also likely that as new names pop up in the rankings, it will take awhile before they settle into our minds as being a typical "top 10" or "top 20" guy. But then, in a few years, the names will sound more legitimate than the most recent newcomers.
SO, CASE CLOSED?
Hardly! The point of statistical analysis is almost never end a debate, but to add more fuel to the fire. Until a time machine is invented and a All Star competition between the various classes can be wrestled, the only thing for certain is that the debate will rage for as long as there are wrestling fans. As such, please don't hesitate to rage away in the comments.
Related Content
 The NCAA Women's Freestyle Transfer Portal Is Open
Apr 26, 2024
 78 kg Cons 8 #2 - James Ivaldi, Mad Cow Wrestling Club vs Kadyr Keneshov, Colorado
Apr 26, 2024
 70 kg Cons 8 #2 - Stefan Bittmann, Nevada vs Marc Wolfgang, Massachusetts
Apr 26, 2024
 100 kg Cons 8 #2 - Jesse Campos, Las Vegas Wrestling Club vs Dave Hart, Colorado
Apr 26, 2024
 70 kg Round 3 - Steve Ferguson, Wrestling With Character vs Bruce Moe, Bison Wrestling Club
Apr 26, 2024
 68 kg Cons 8 #1 - Henrik Sperlazza, MN Elite Wrestling Club vs Brady Ritter, Bolingbrook Junior Raiders Wrestling Club
Apr 26, 2024
 75 kg Cons 8 #1 - Nolan McCarthy, Grindhouse Wrestling Club vs Layth Qouchbane, Oregon Wrestling National Team
Apr 26, 2024
 58 kg Round 3 - Kevin Grant, Maui Style Wrestling vs Daniel Cota, Mad Cow Wrestling Club
Apr 26, 2024
 62 kg Round 3 - Matthew Robertson, Fitness Quest Wrestling Club vs Roger Papotto, Florida
Apr 26, 2024